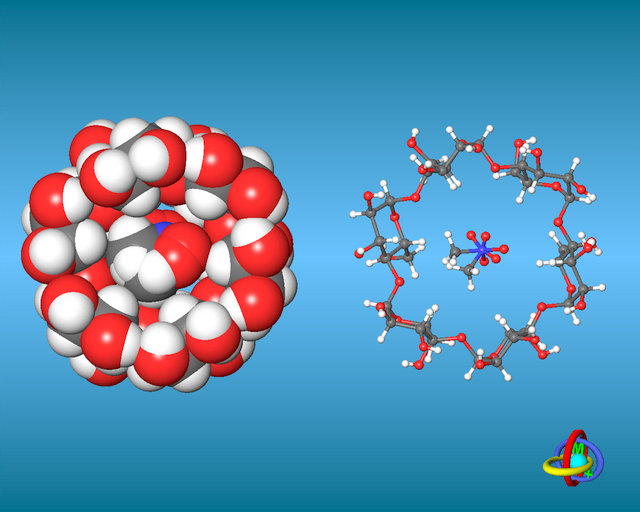
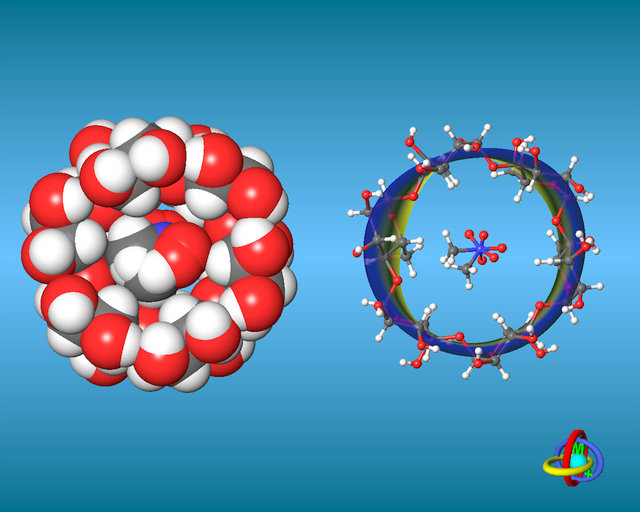
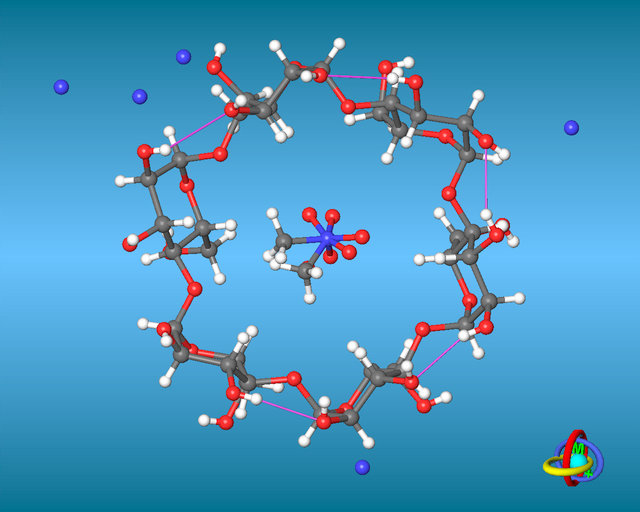
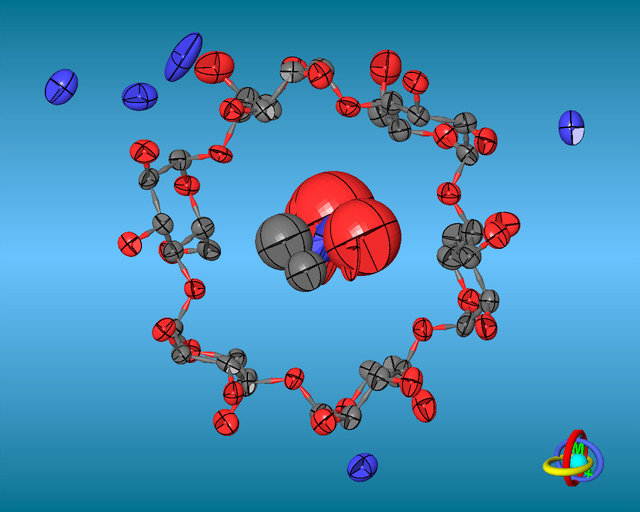
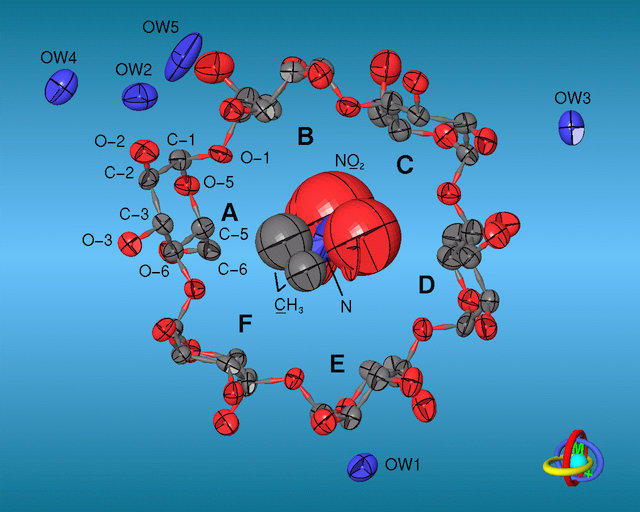
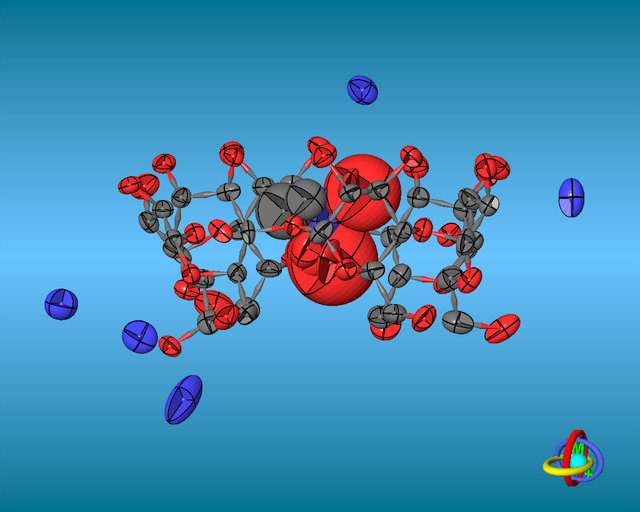
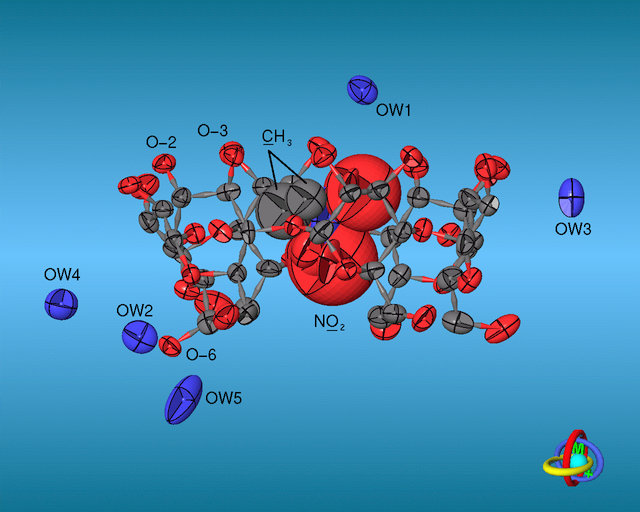
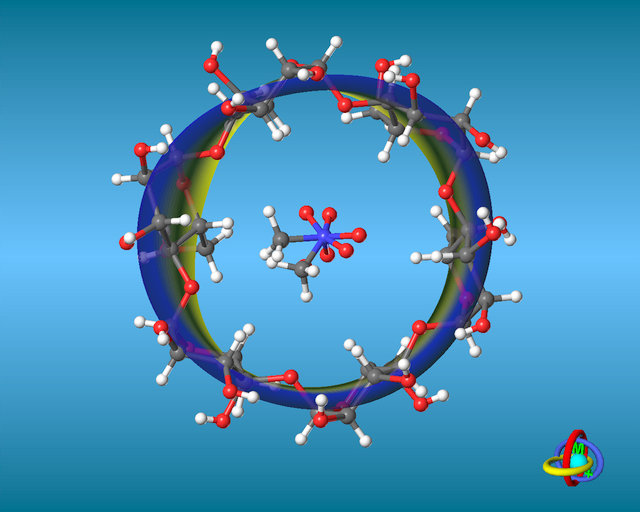
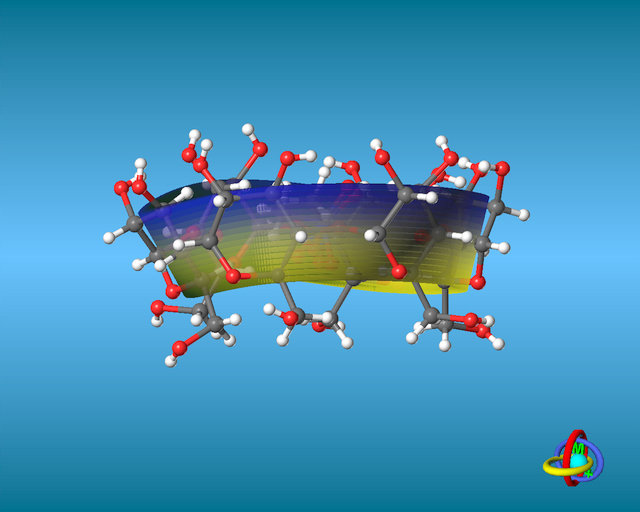
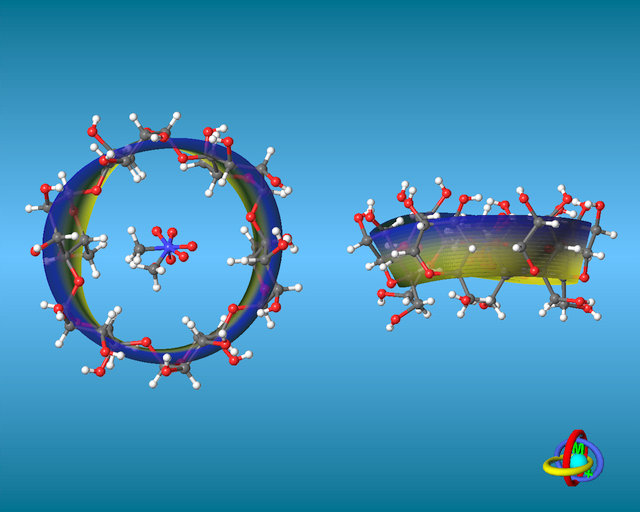
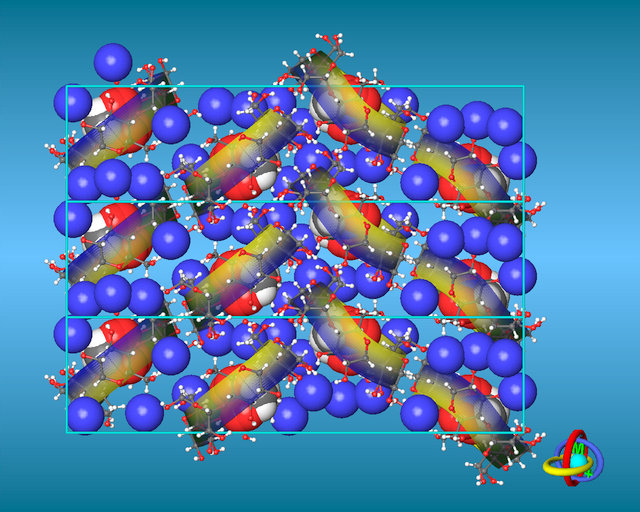
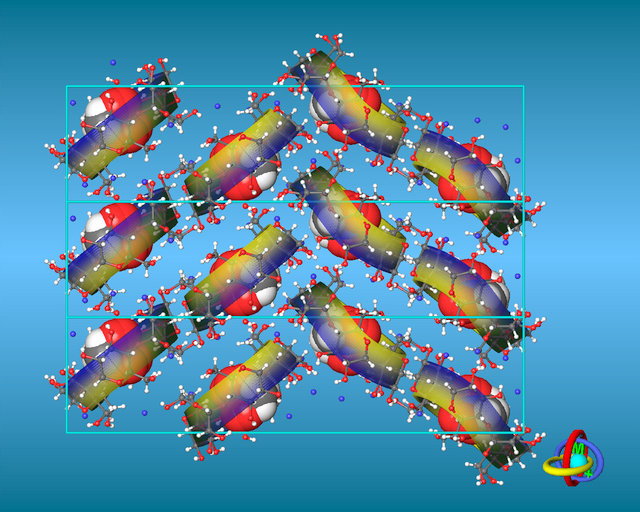
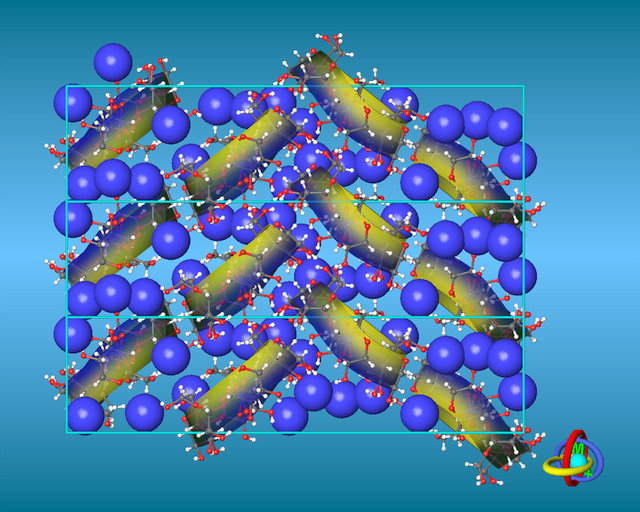
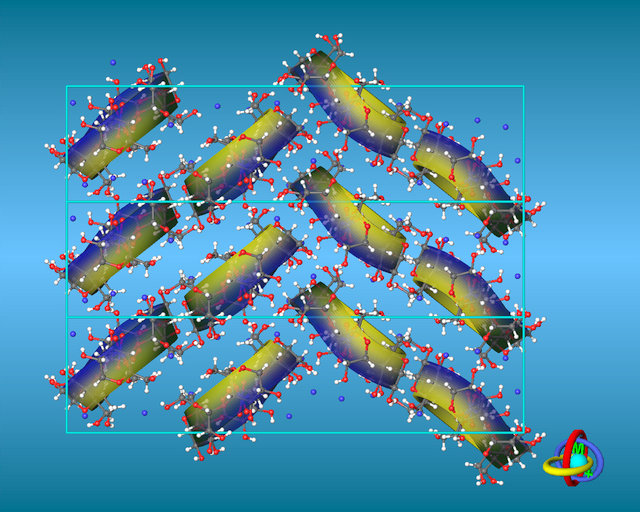
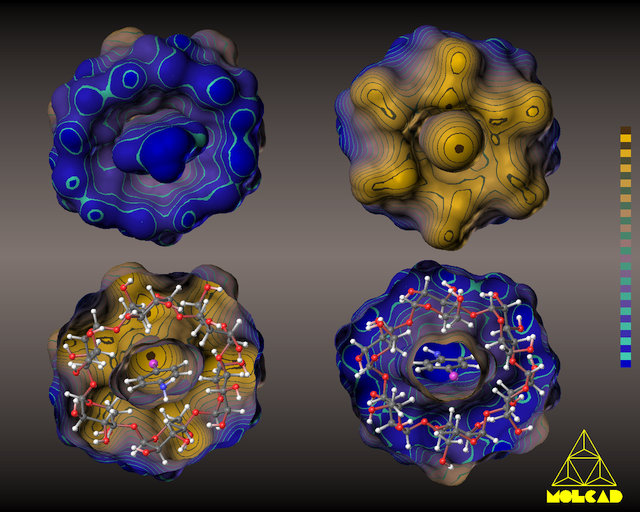
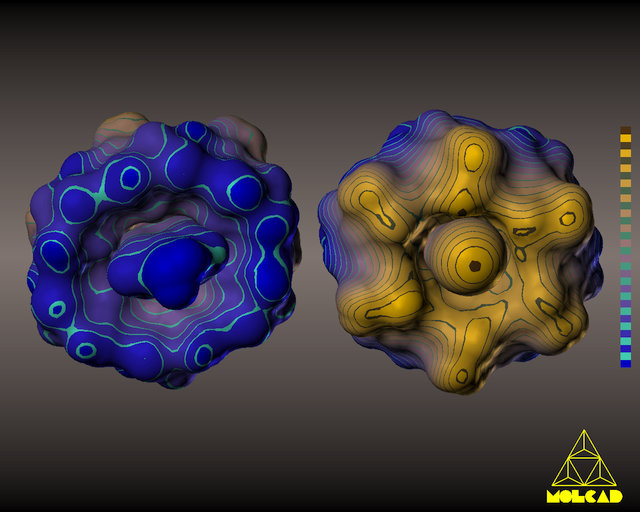
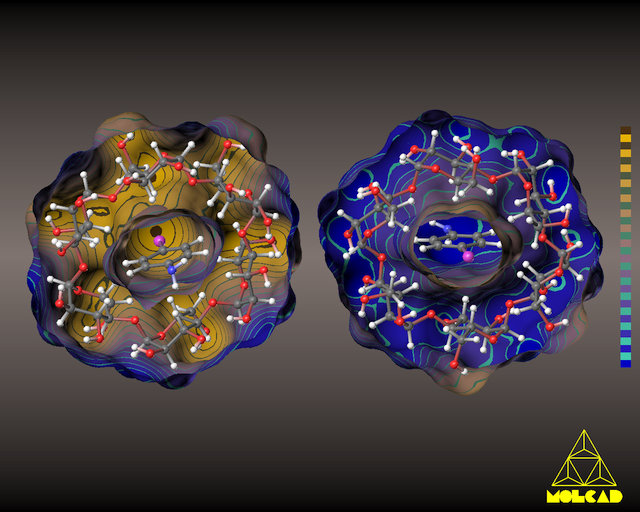
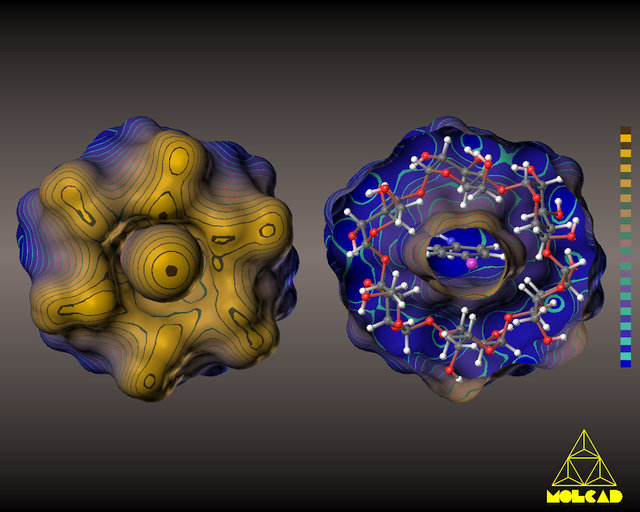
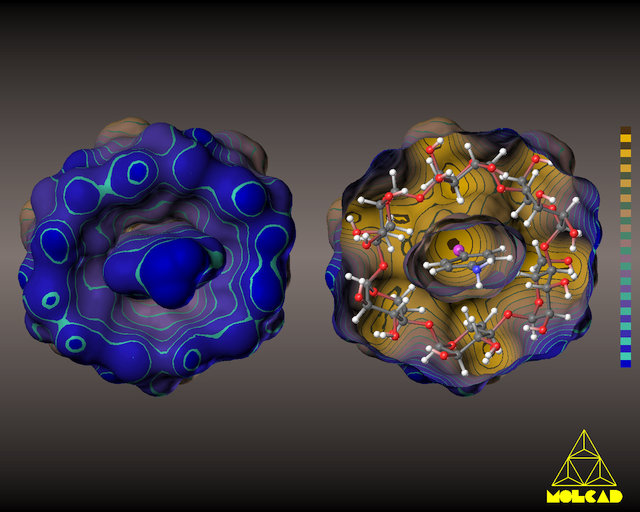
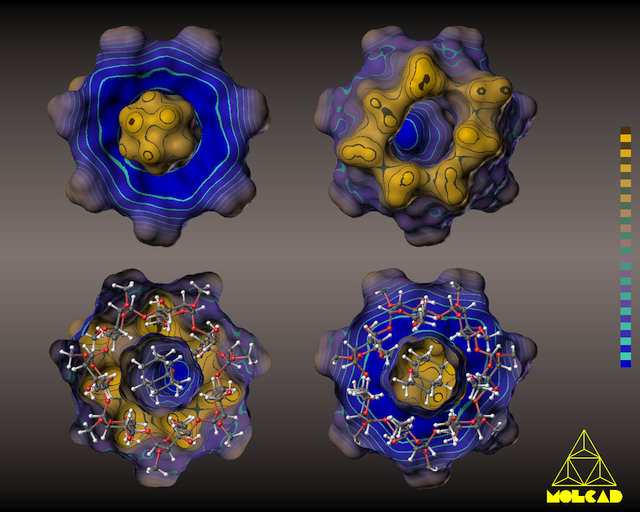
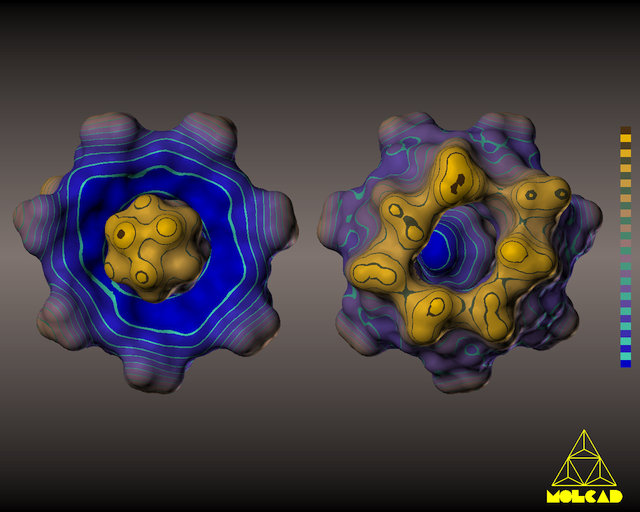
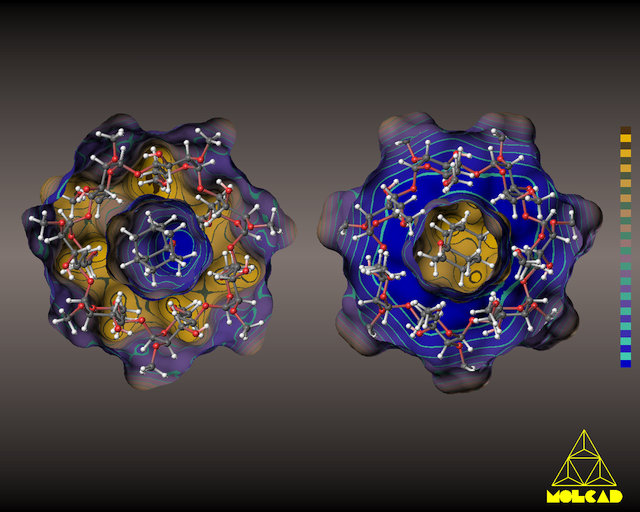
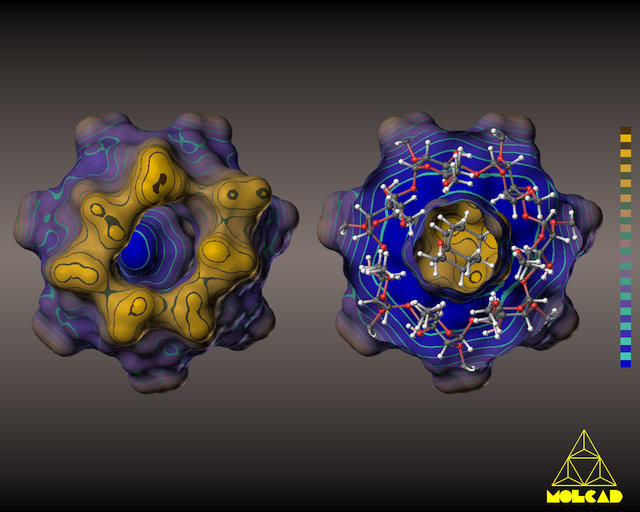
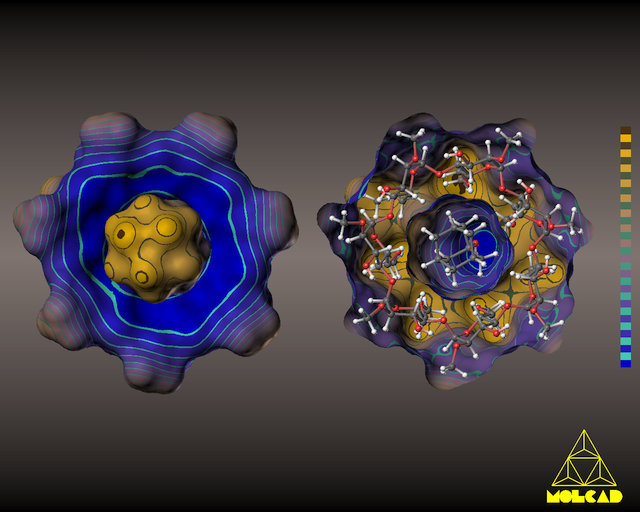
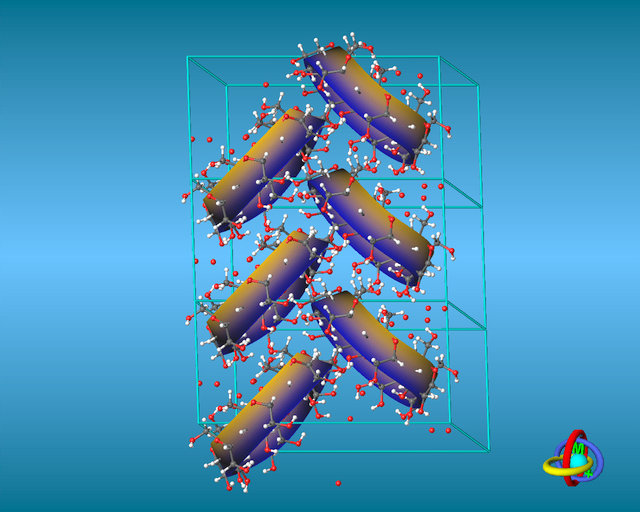
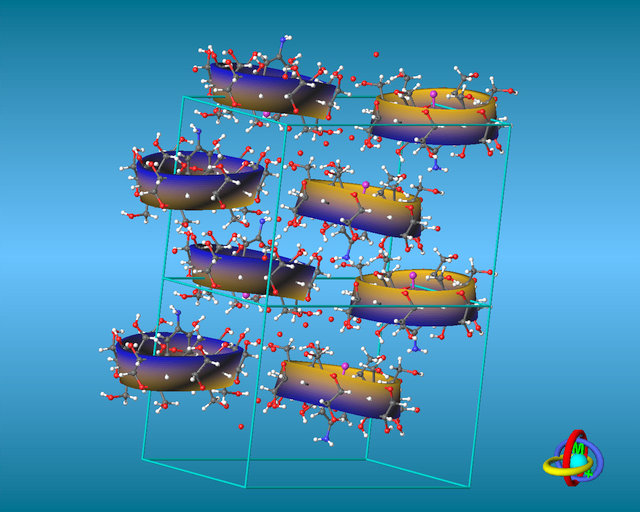
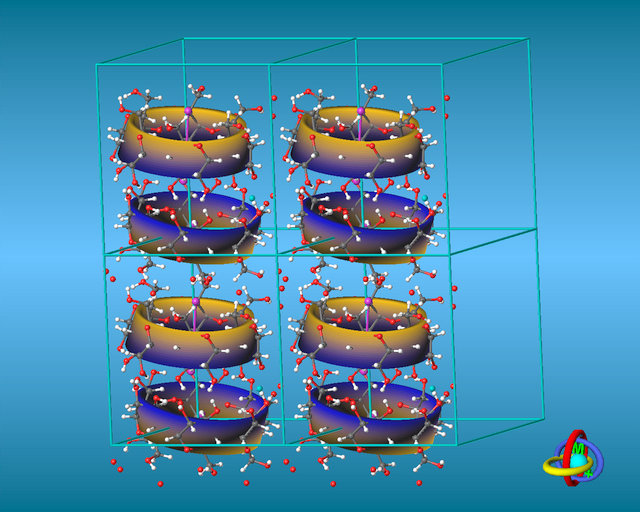
Solid-state structures of the α-CD nitromethane inclusion complex.
For details see:
Molecular Modeling of Saccharides, Part XXIII.
Topography of the 1:1 α-Cyclodextrin - Nitromethane Inclusion Complex.
T. Nakagawa, S. Immel, F. W. Lichtenthaler, and H. J. Lindner, Carbohydr. Res. 2000, 324, 141-146.
Abstract / Fulltext PDF
Solid-state structures of
α-CD p-iodoaniline trihydrate [1b],
β-CD 1,4-butanediol * 6.25 H2O [2],
γ-CD 12-crown-4 ether nonahydrate [3], and
per-2,6-O-methyl-β-CD adamantanol dodecahydrate [4] inclusion complexes.
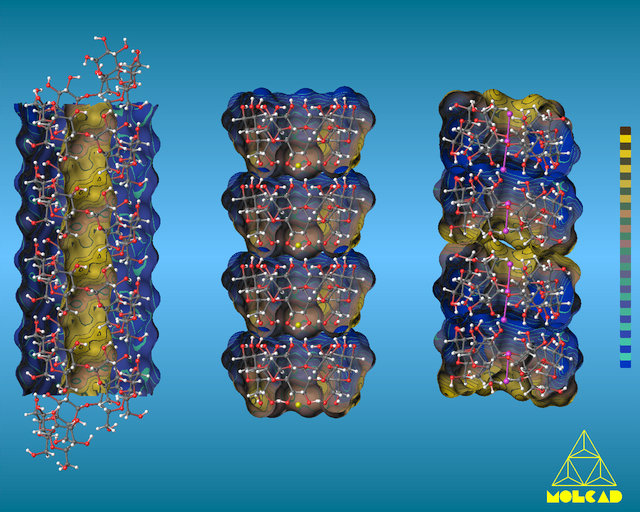
In all cases, the water of crystallization was removed. Surfaces and MLPs were
calculated for all molecules separately, the complexes were subsequently
reassembled. The MLPs were scaled for all molecules individually, no absolute
values are displayed.
| Image Notes |
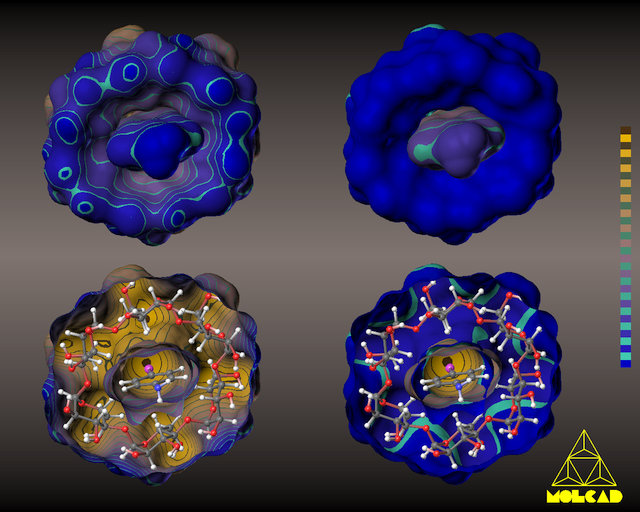
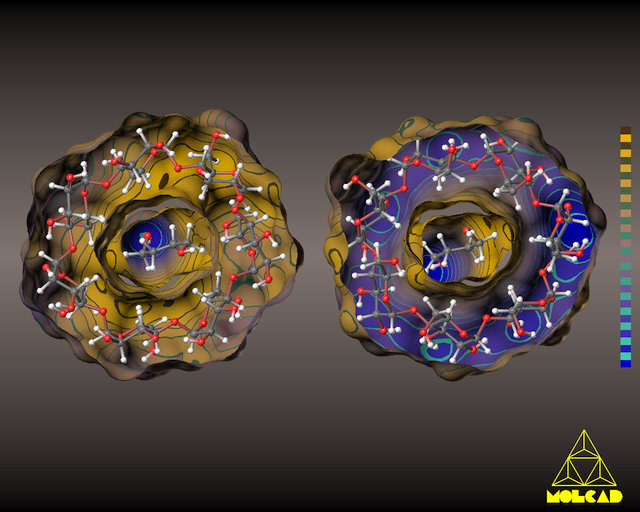
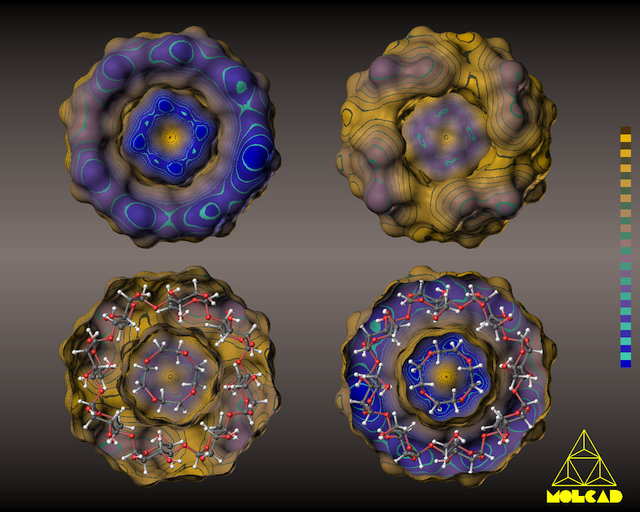
| mlp3 |
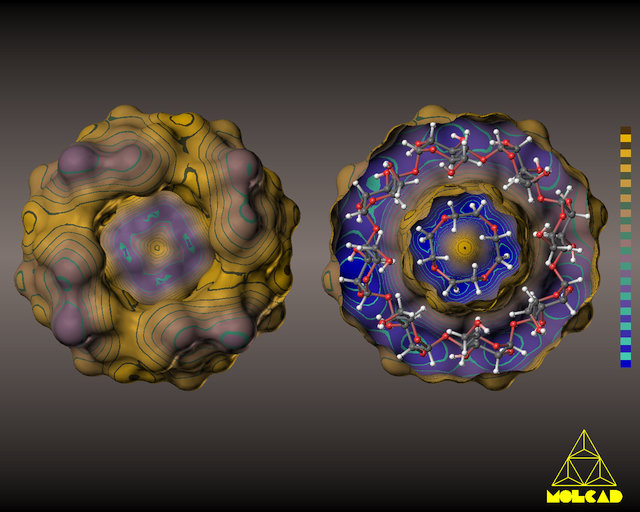
View on the 2-OH and 3-OH side of the torus (left side each), and on the 6-CH2OH side (right models); in the lower entries, the front-half of the surfaces has been clipped off. |
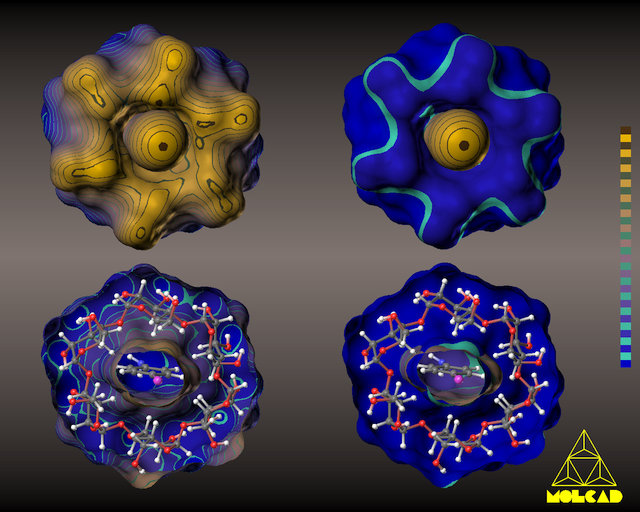
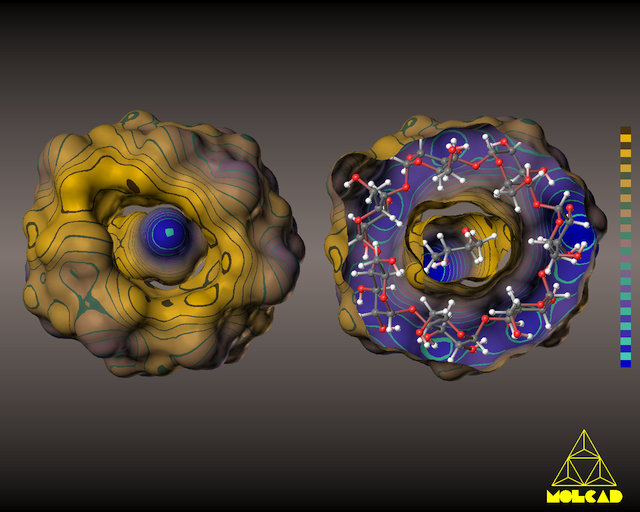
| mlp4 |
View on the 2-OH and 3-OH side of the torus (left side each), and on the 6-CH2OH side (right models) |
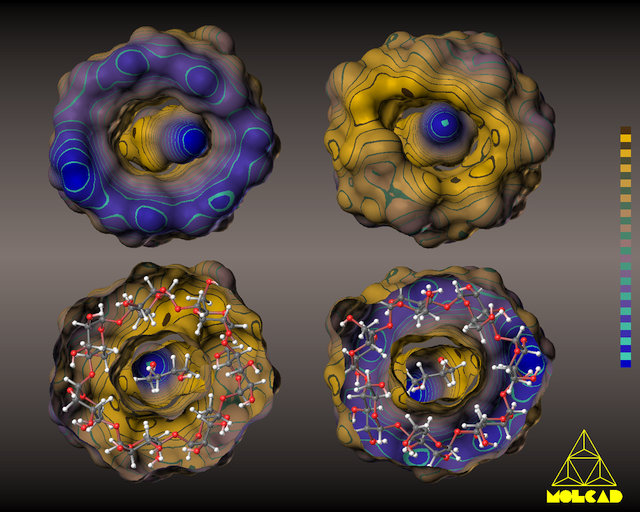
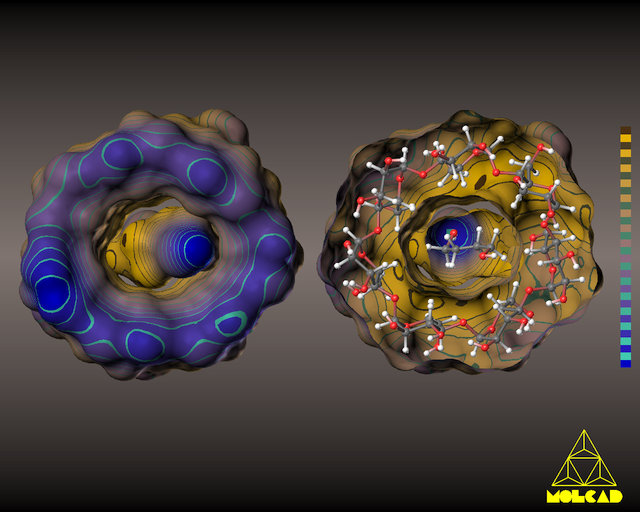
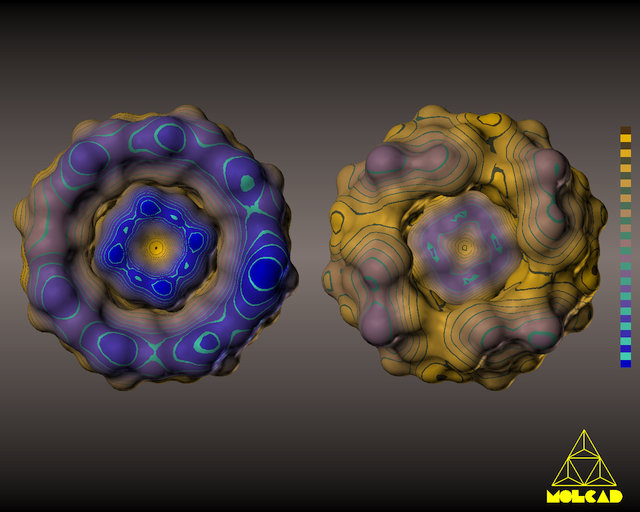
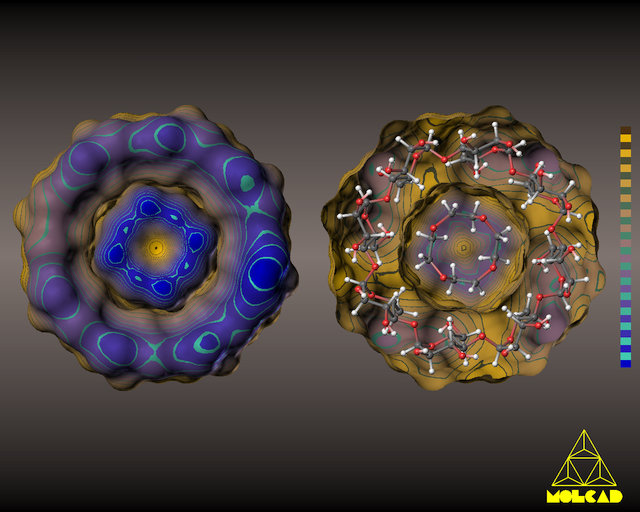
| mlp5 |
View on the 2-OH and 3-OH side of the torus (left side each), and on the 6-CH2OH side (right models), with the front-half of the surfaces being clipped off. |
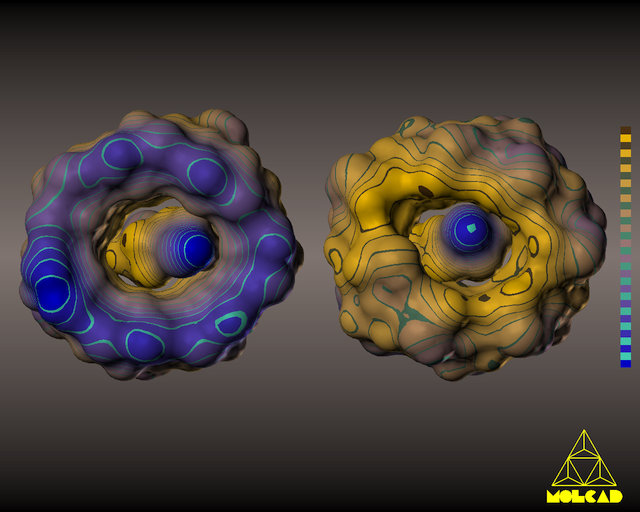
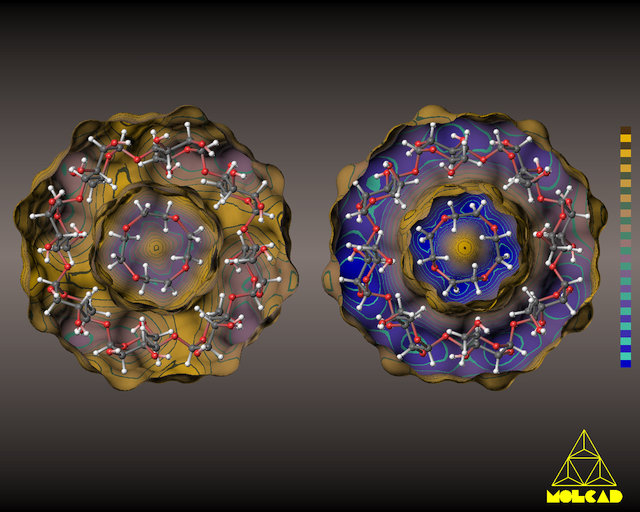
| mlp6 |
View on the 6-CH2OH side (both entries), with the front-half of the surfaces being clipped off in the right model. |
| mlp7 |
View on the 2-OH and 3-OH side (both entries), with the front-half of the surfaces being clipped off in the right model. |
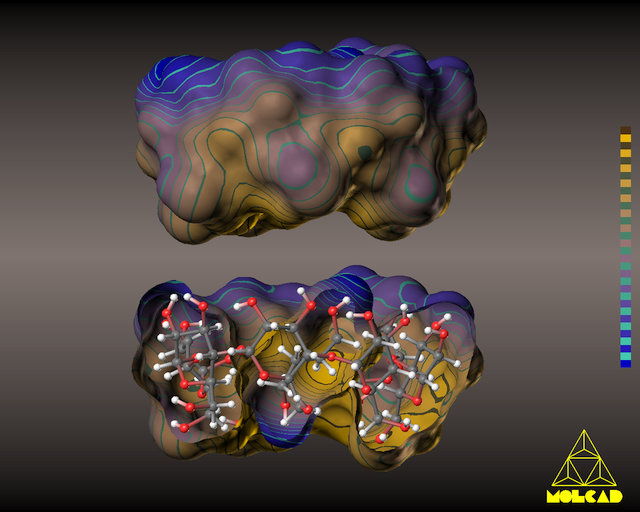
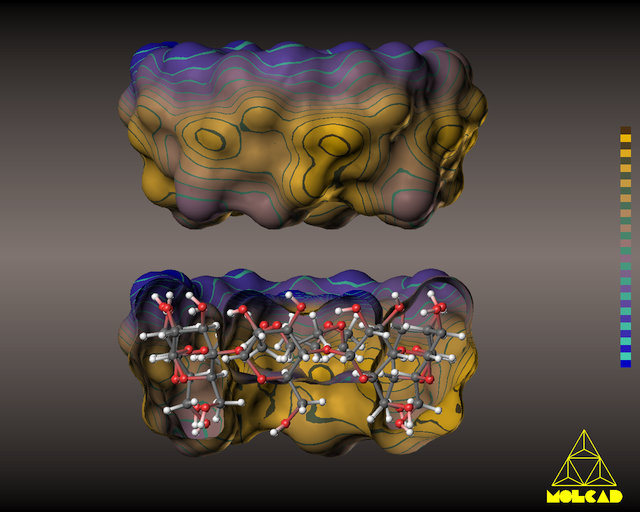
| mlp8,9 |
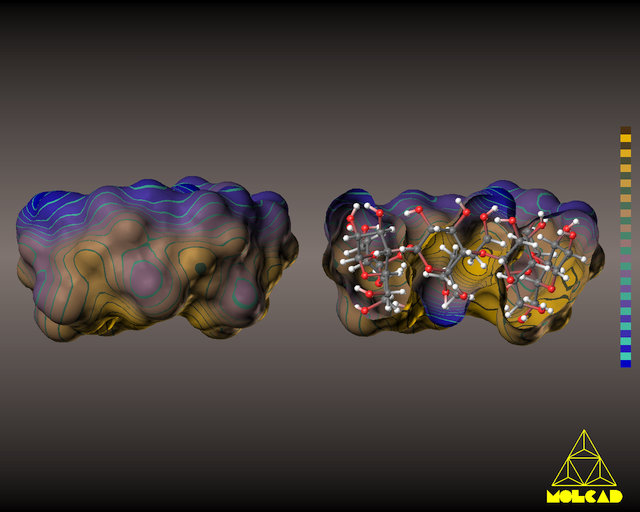
Side view models with all 2-OH and 3-OH groups pointing up, and the 6-CH2OH groups pointing down |
| mlp0 |
Side view models with all 2-OH and 3-OH groups pointing up,
and the 6-CH2OH groups pointing down. In the left models, the MLPs are scaled
for each molecule separately (individually). In the right entries, global
(absolute) scaling was applied. |
| mlp1 |
View on the 2-OH and 3-OH side of the torus, MLP-scaling as
in cia_mlp0 |
| mlp2 |
View on the 6-CH2OH side, MLP-scaling as in cia_mlp0 |
For details see:
Molecular Modeling of Saccharides, Part XI.
Towards Understanding the Formation and Stability of Cyclodextrin Inclusion Complexes: The Lipophilicity Patterns of some Typical Examples.
F. W. Lichtenthaler and S. Immel, Starch/Stärke 1996, 48, 145-154.
Abstract
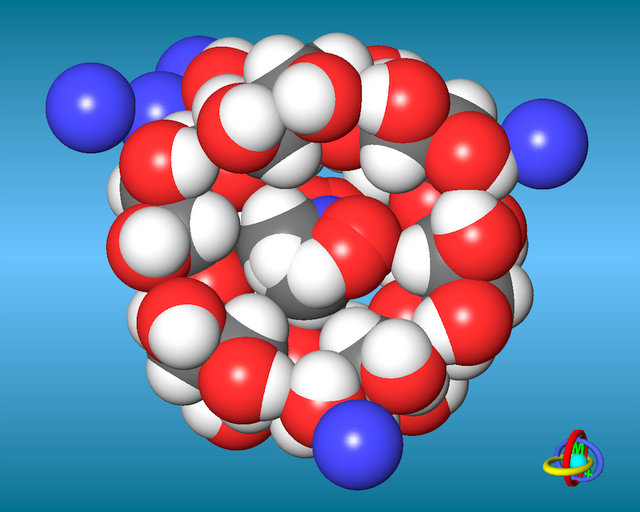
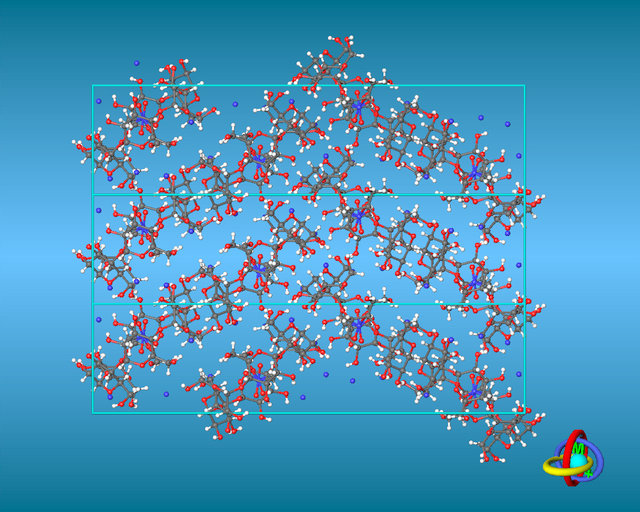
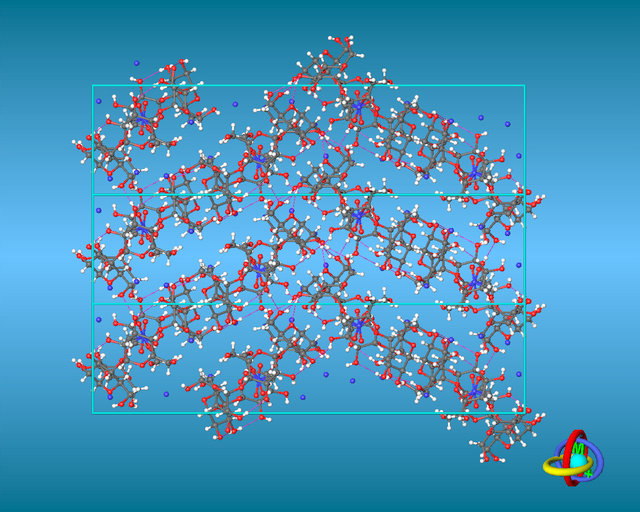
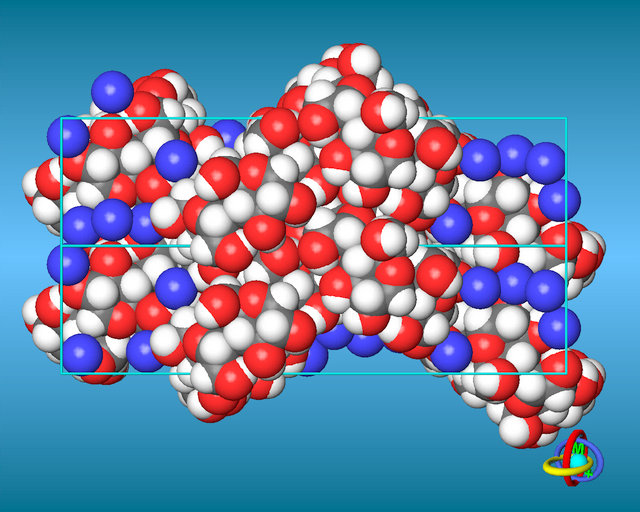
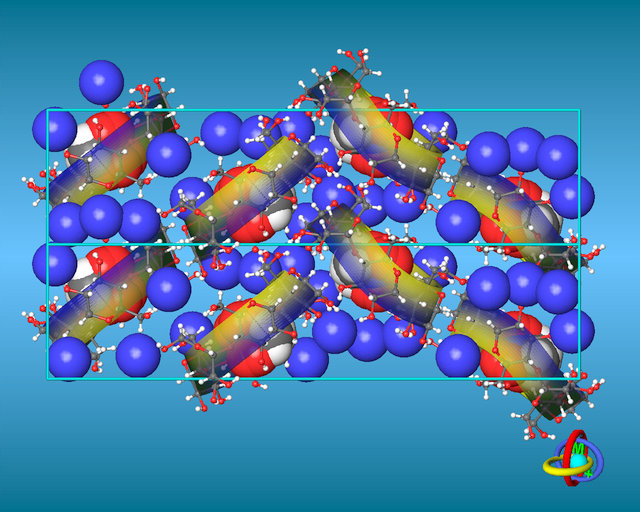
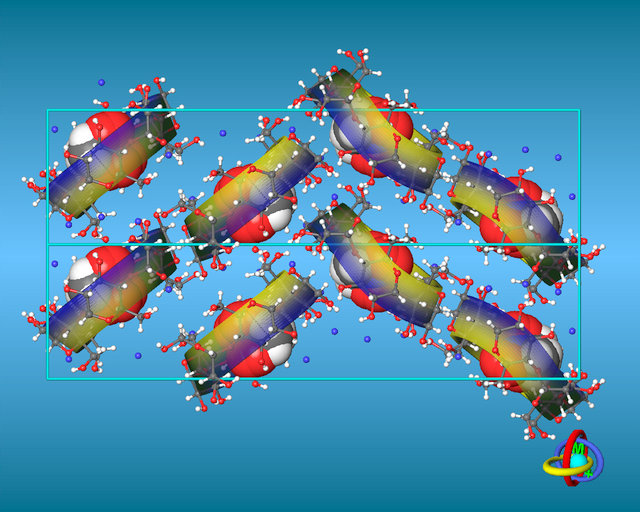
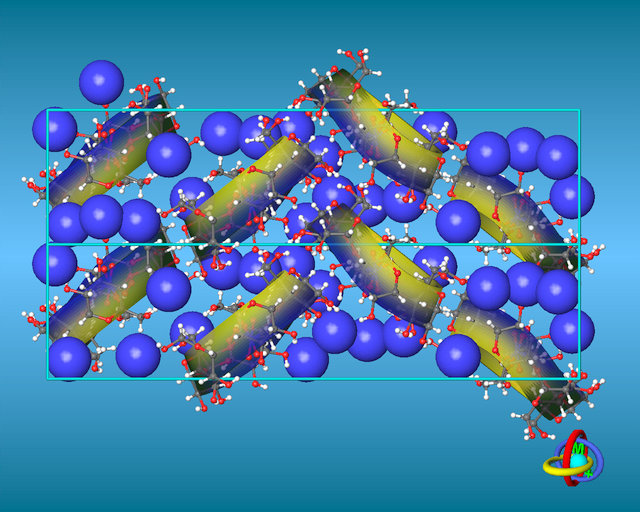
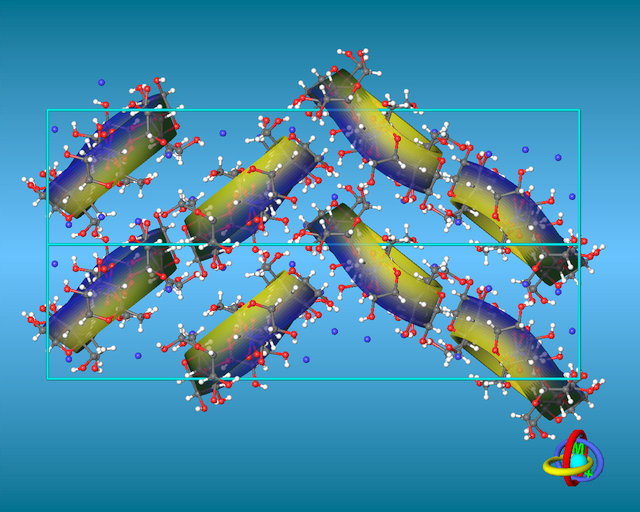
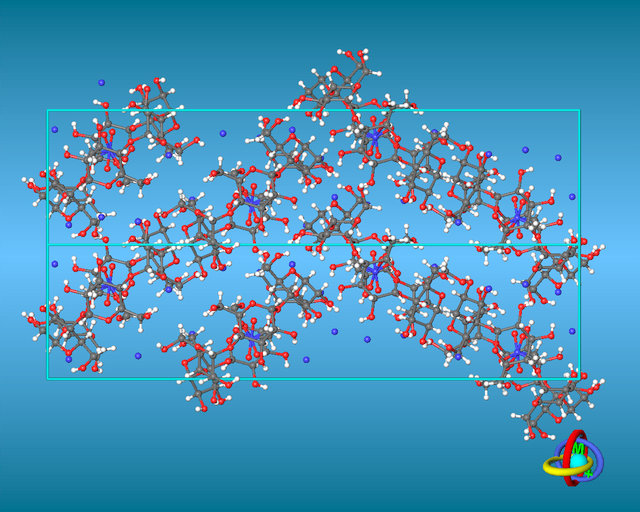
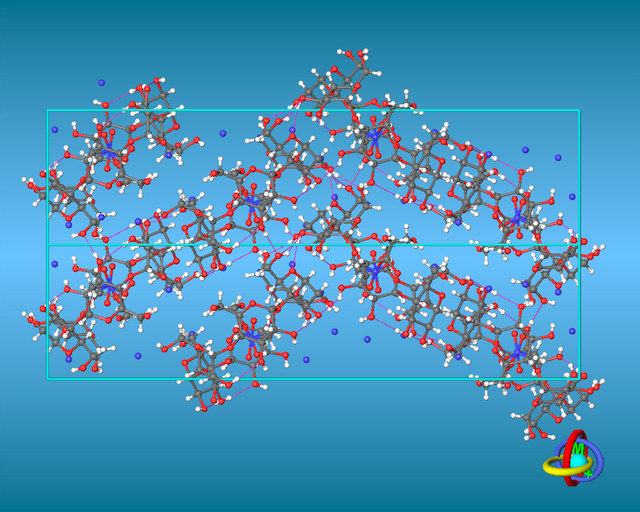
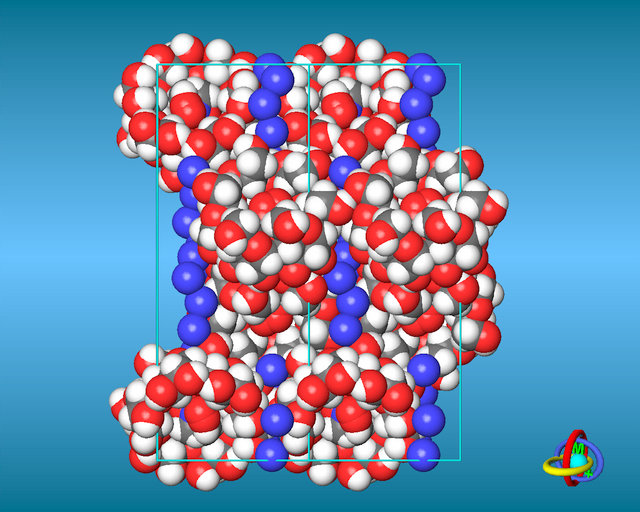
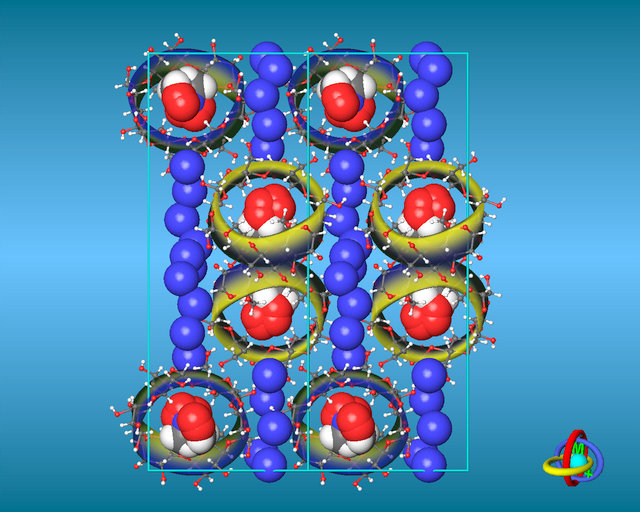
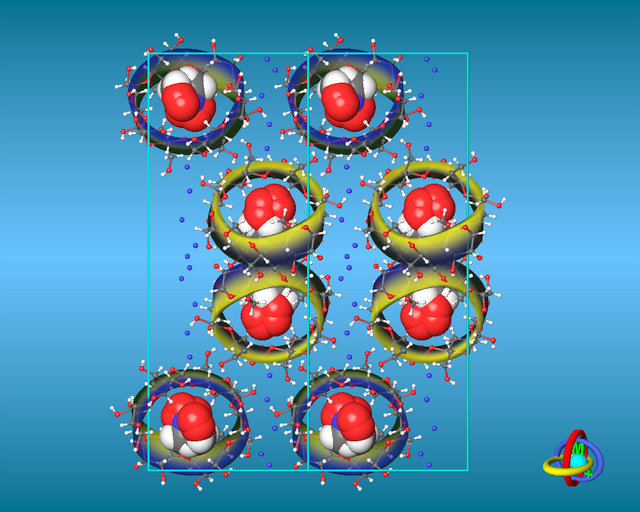
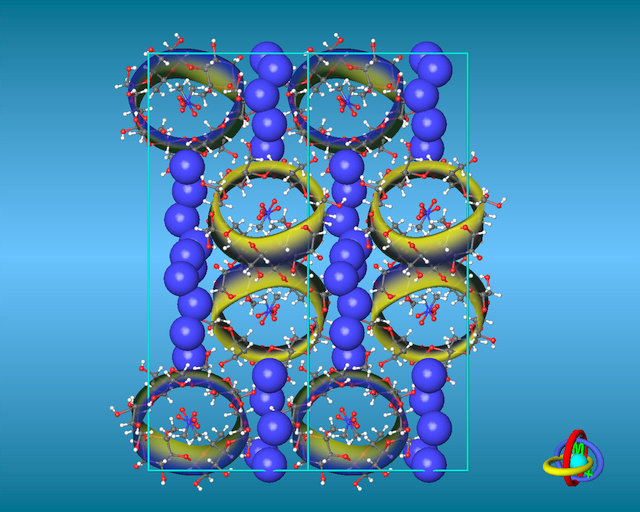
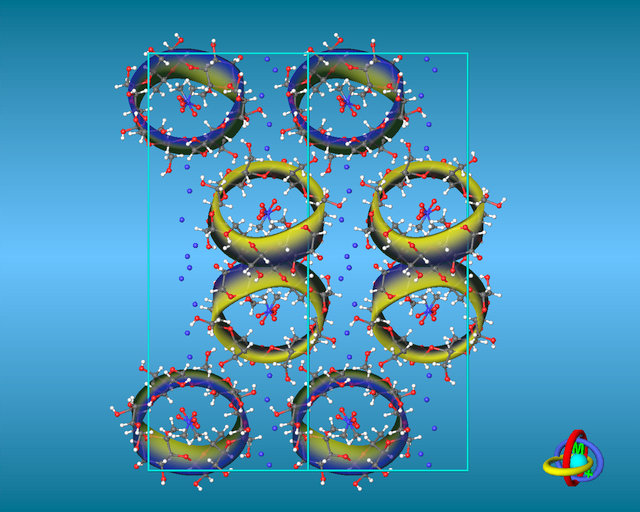
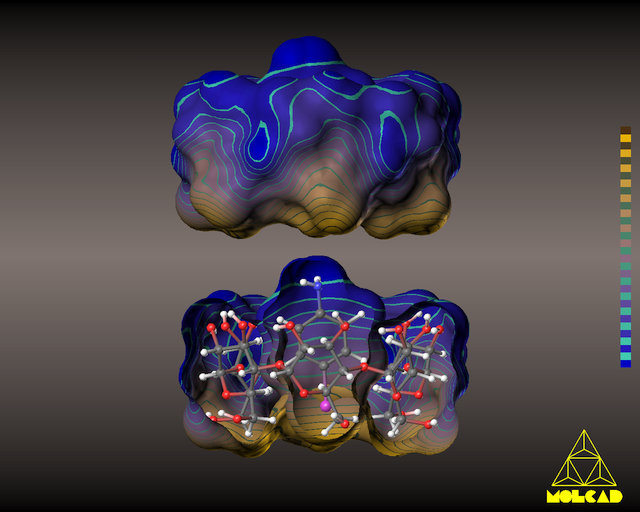
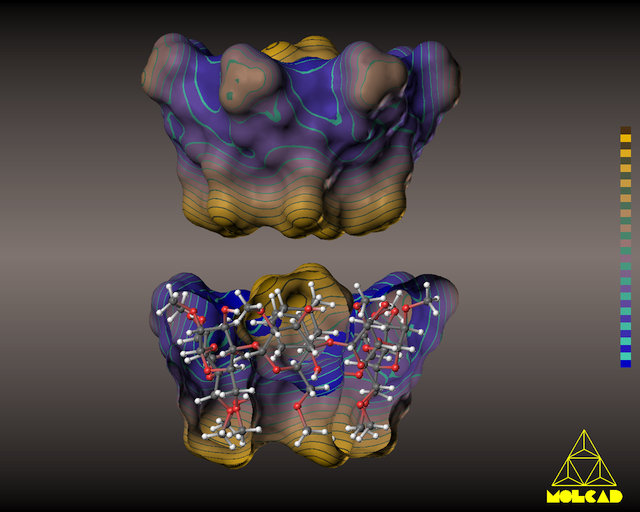
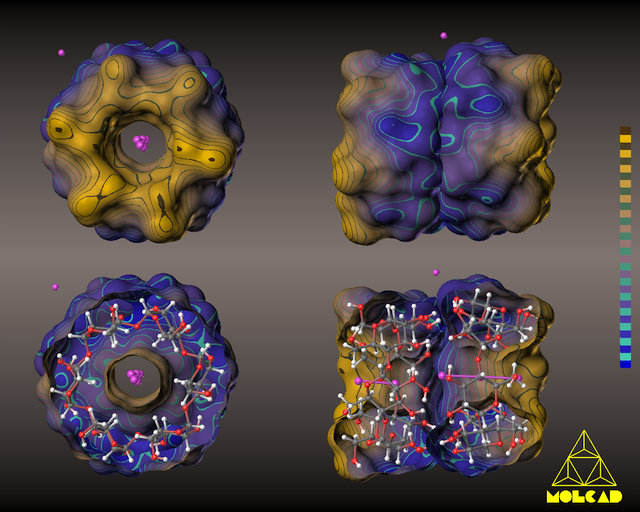
Solid-state structures of the bis(α-CD) lithium triodide iodine octahydrate inclusion complex [5].
For details see:
Molecular Modeling of Saccharides, Part XI.
Towards Understanding the Formation and Stability of Cyclodextrin Inclusion Complexes: The Lipophilicity Patterns of some Typical Examples.
F. W. Lichtenthaler and S. Immel, Starch/Stärke 1996, 48, 145-154.
Abstract
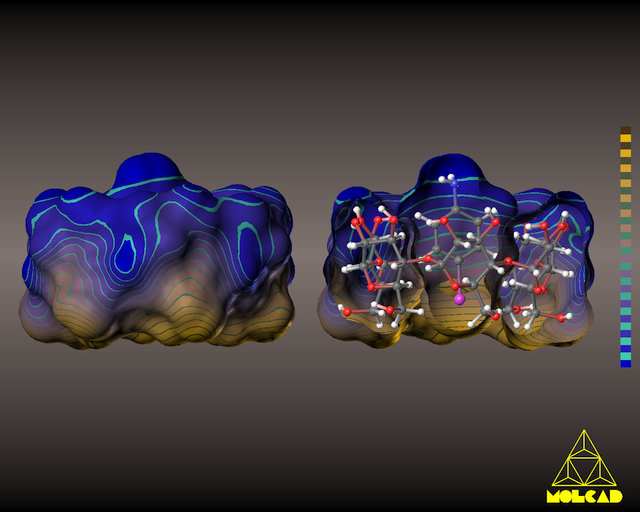
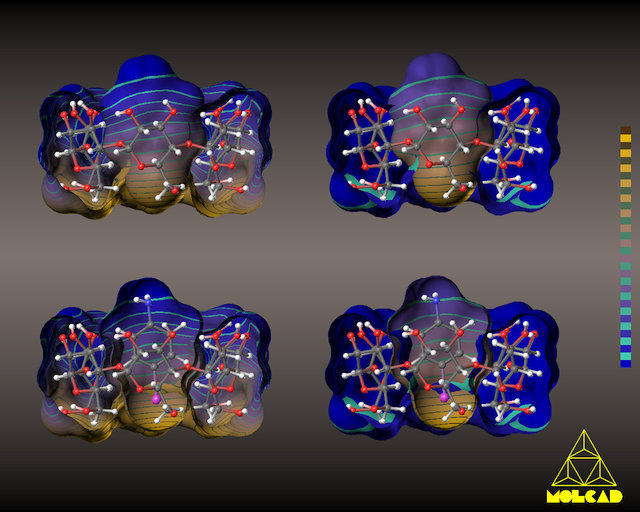
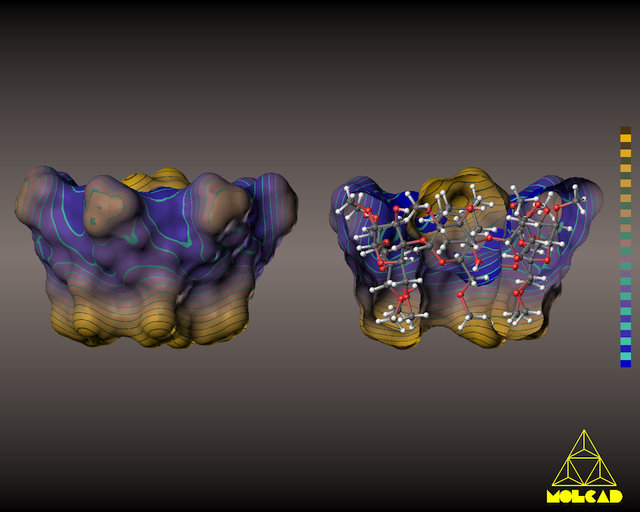
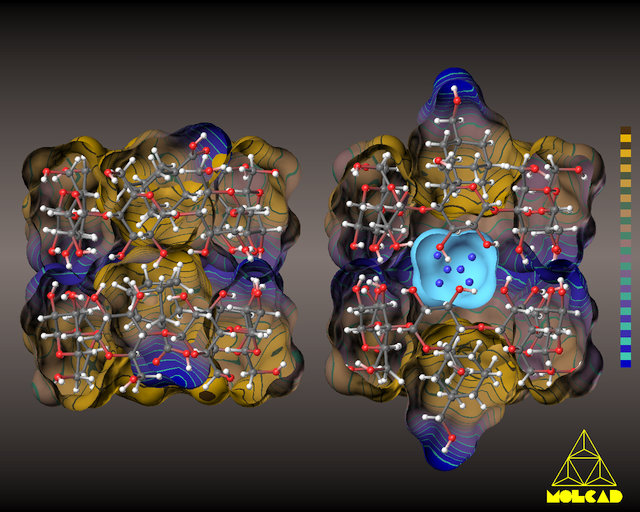
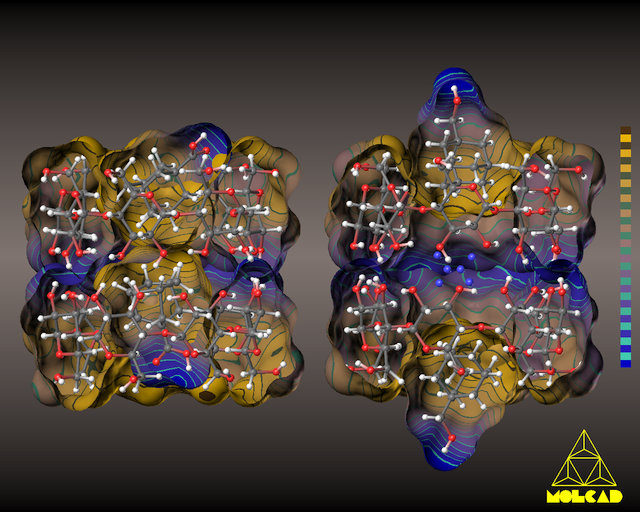
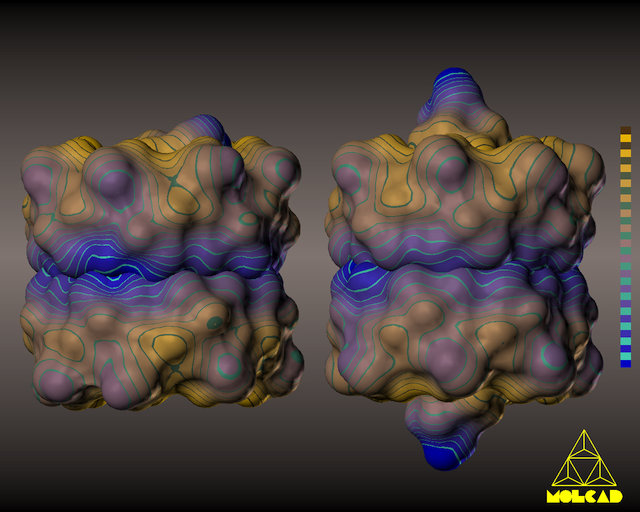
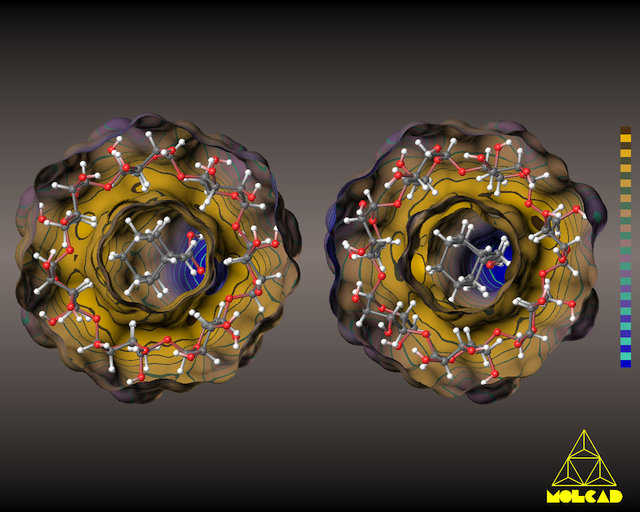
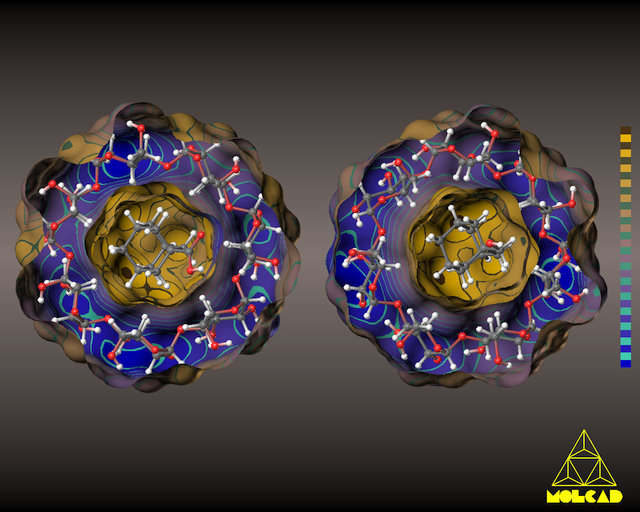
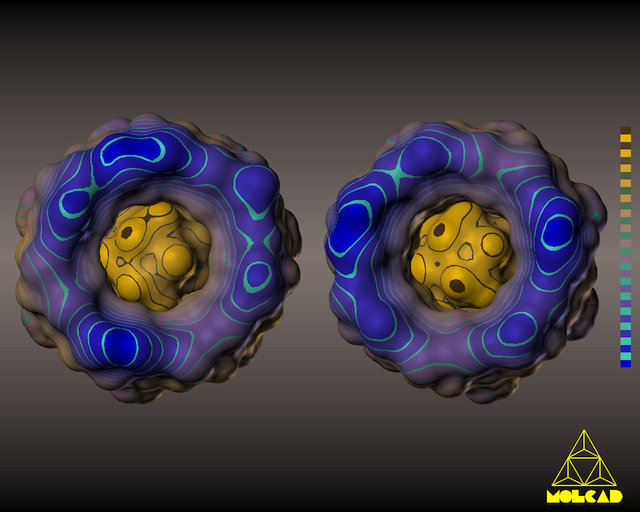
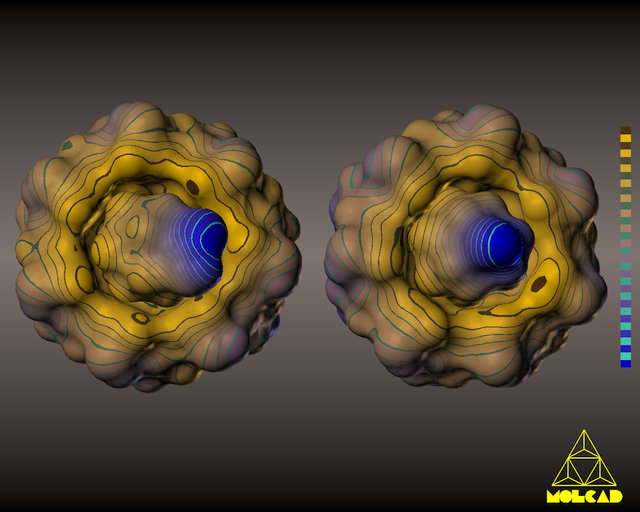
Solid-state structures of
β-CD 1-adamantane-carboxylic acid pentadecahydrate (left models each) [6] and
β-CD 1-hydroxymethyl-adamantane undecahydrate (right models) [7]
(private MLP scaling in all cases).
| Image Notes |
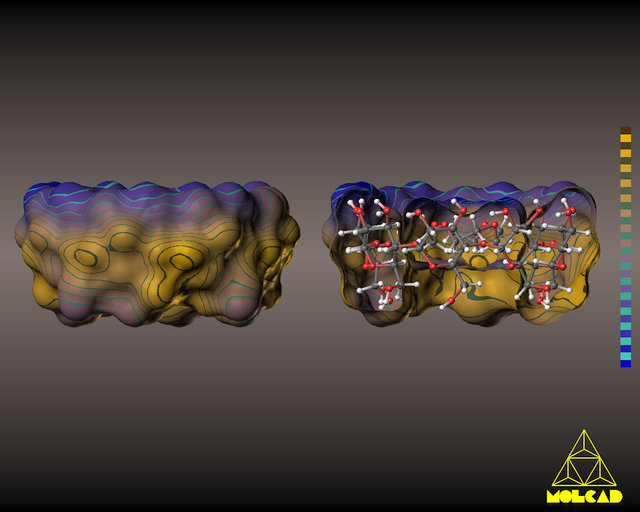
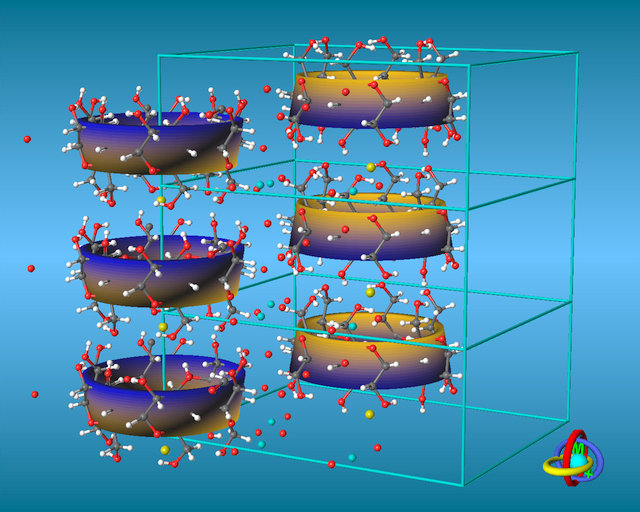
| mlp0-2 |
Side view models of the dimeric units of the complexes in the solid-state. In "ada_mlp0" three water molecules are disordered over six positions (marked by the blue dots) within the central cavity, the approx. volume demanded by these water molecules is indicated by the light blue surface. |
| mlp3,5 |
View on the 2-OH and 3-OH side of one cyclodextrin unit each |
| mlp4,6 |
View on the 6-CH2OH side of one cyclodextrin unit |
For details see:
Molecular Modeling of Saccharides, Part XI.
Towards Understanding the Formation and Stability of Cyclodextrin Inclusion Complexes: The Lipophilicity Patterns of some Typical Examples.
F. W. Lichtenthaler and S. Immel, Starch/Stärke 1996, 48, 145-154.
Abstract
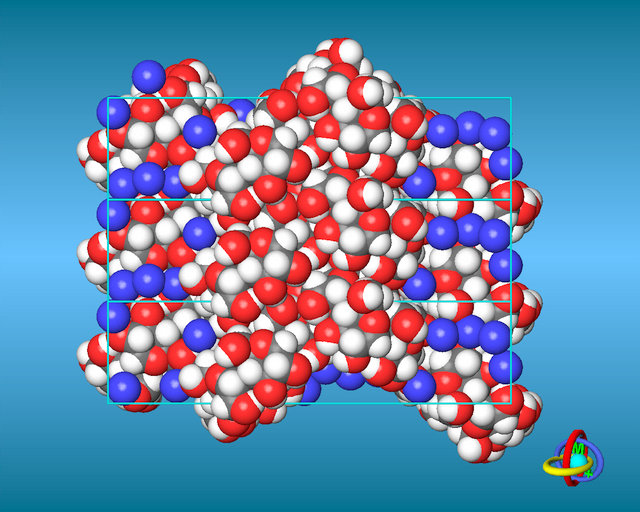
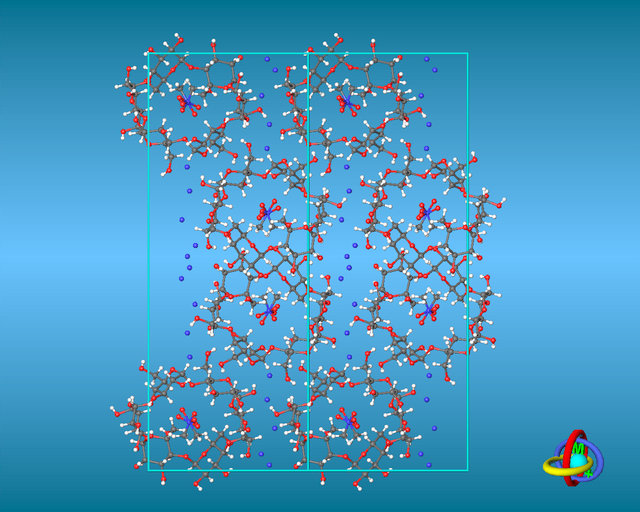
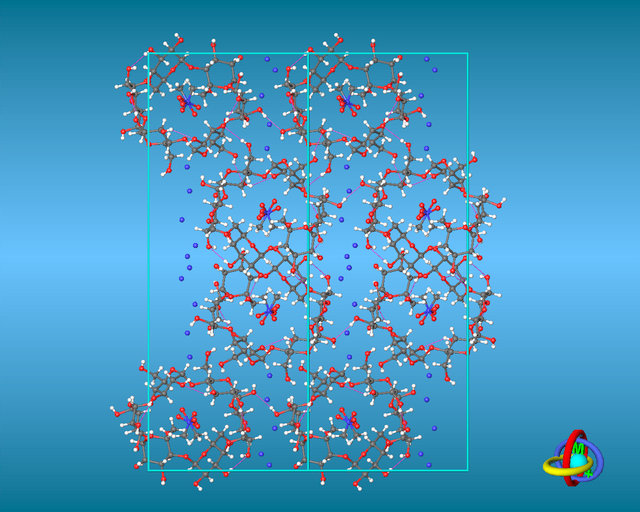
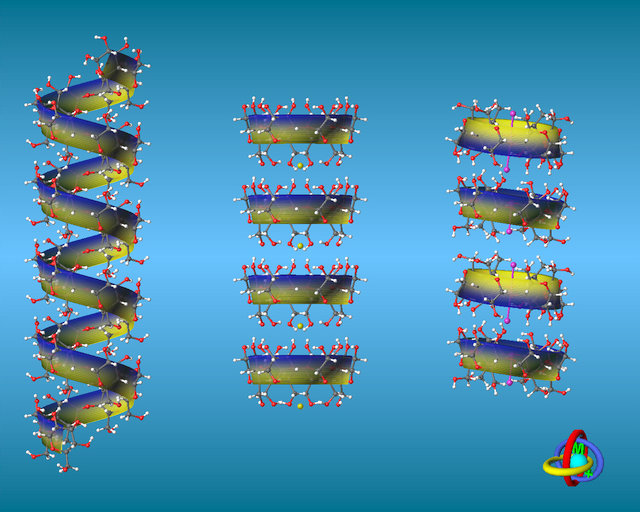
Different packing schemes for solid-state structures of cyclodextrins as compared to amylose.
References (incl. CCDF-Refcodes)
| [1] |
(a) W. Saenger, K. Beyer and P. C. Manor, Acta Crystallogr., Sect. B, 1976, 32, 120-128 (CDEXIA01).
(b) K. Harata, Bull. Chem. Soc. Jpn. 1975, 48, 2409-2413 (CDEXIA10).
|
| [2] |
T. Steiner, G. Koellner, and W. Saenger, Carbohydr. Res. 1992, 228, 321-332 (KUTKOZ).
|
| [3] |
S. Kamitori, K. Hirotsu, and T. Higuchi, J. Chem. Soc., Chem. Commun., 1986, 690-691 (DOCYID).
|
| [4] |
M. Czugler, E. Eckle, J. J. Stezowski, J. Chem. Soc., Chem. Comm. 1981, 1291 (BEFJOL).
|
| [5] |
M. Noltemeyer, W. Saenger, J. Am. Chem. Soc. 1980, 102, 2710 (CYDXLI10).
|
| [6] |
J. A. Hamilton, M. N. Sabesan, Acta Crystallogr., Sect.B, 1982, 38, 3063 (BOGCAB).
|
| [7] |
J. A. Hamilton, Carbohydr. Res. 1985, 142, 21-37 (FASXUS).
|
|