TUD Organische ChemieImmelGraphicsGallerySweetenersView or Print this frame onlyView or Print (this frame only)

Top of Page Sucralose
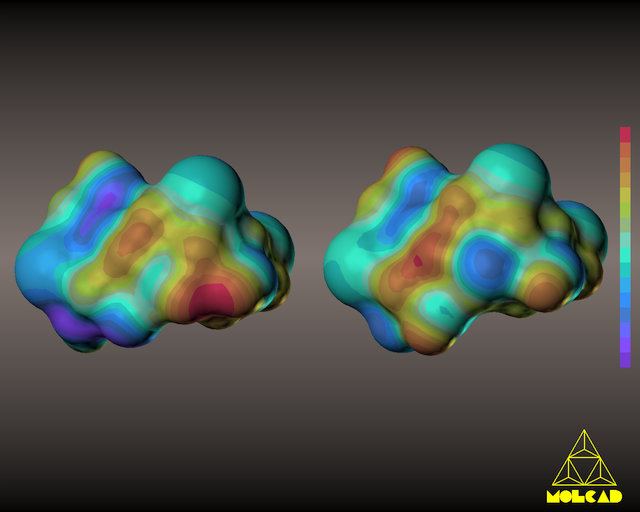
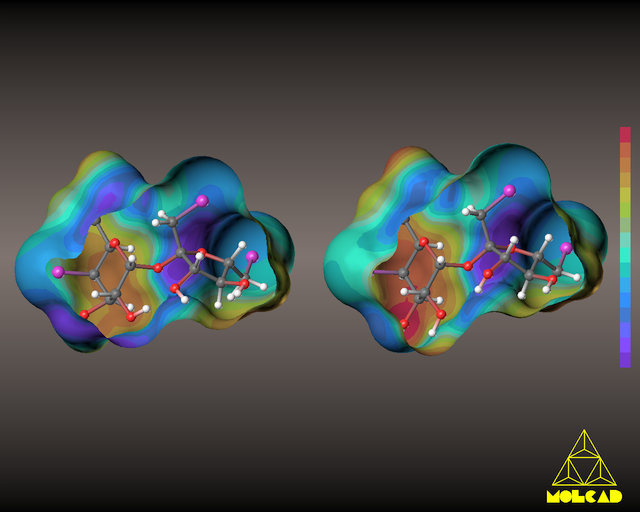
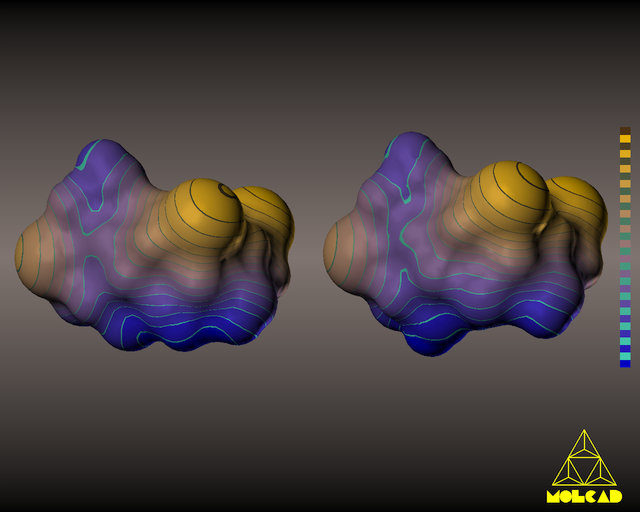
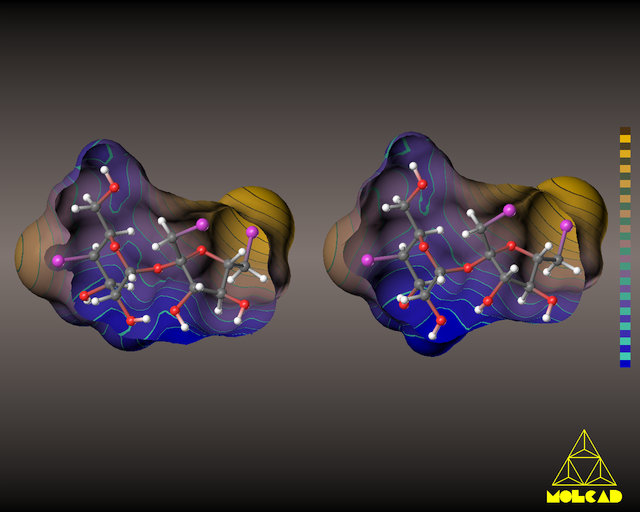
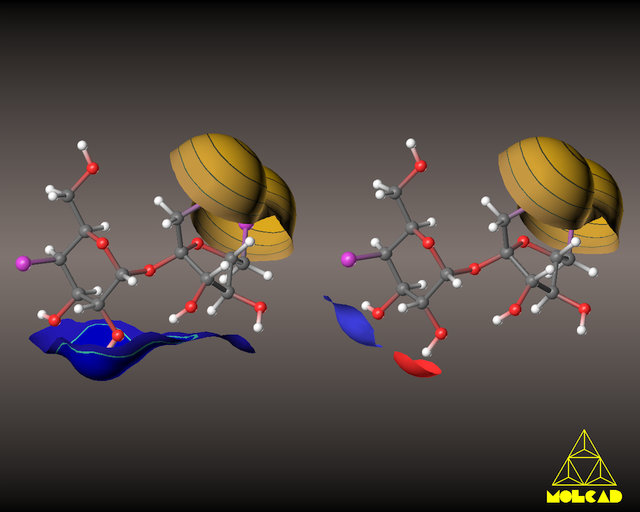
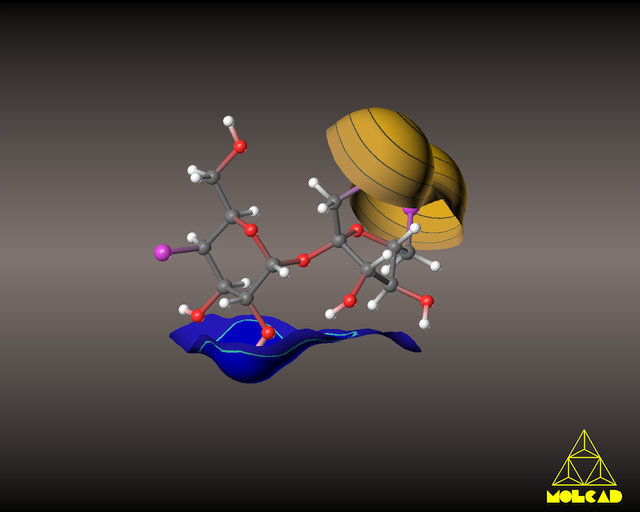
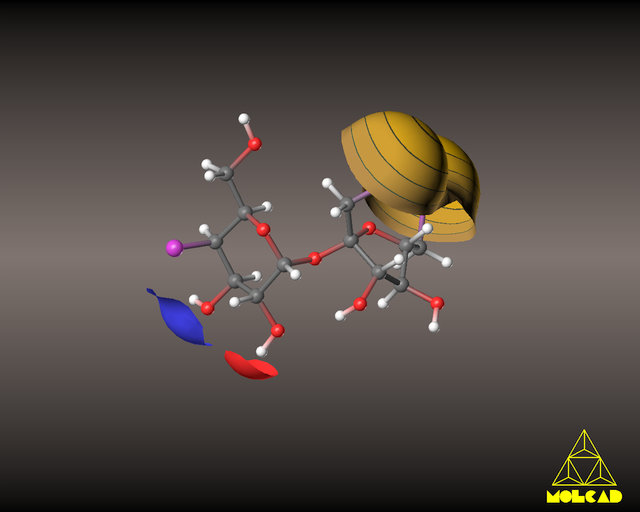
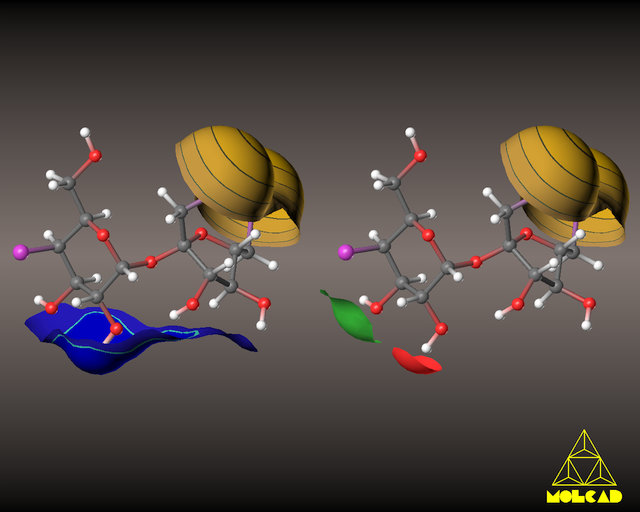
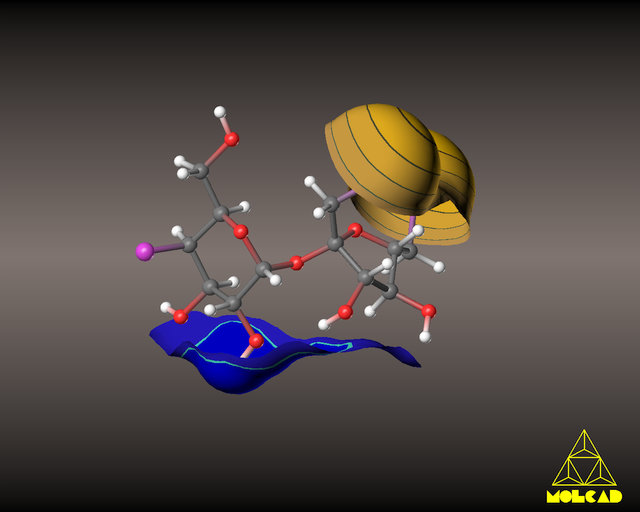
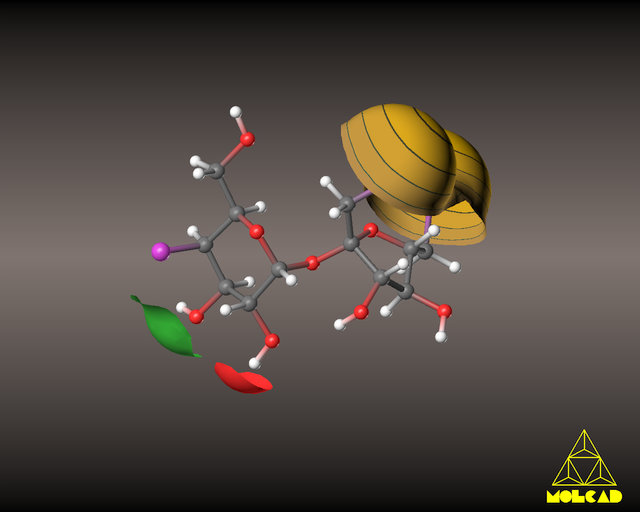
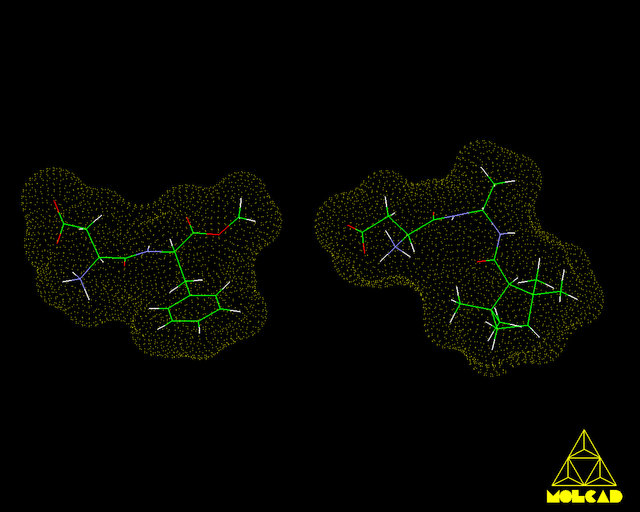
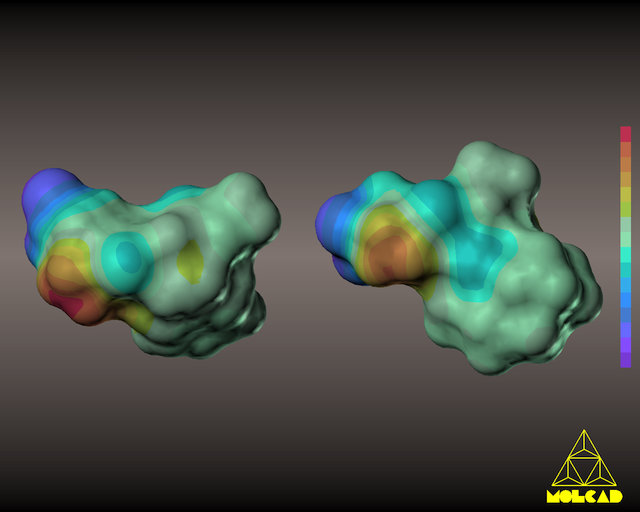
4,1',6'-Trideoxy-4,1',6'-trichloro-Sucrose, X-Ray (left) and PIMM88-Structure (right). Both models differ mainly in the directionality of the 2-O ... HO-3' intramolecular interresidue hydrogen bond.

Click for larger graphics! Click for larger graphics! Click for larger graphics! Click for larger graphics!
mep1 mep2 mlp1 mlp2
Click for larger graphics! Click for larger graphics! Click for larger graphics! Click for larger graphics! Click for larger graphics! Click for larger graphics!
cut1 cut2 cut3 cut4 cut5 cut6

Image Notes
mep1,2 Molecular electrostatic potential profile (MEP, red: positive, violet: negative potentials), AM1 atomic charges
mlp1,2 Molecular lipophilicity pattern (MLP, yellow-brown: hydrophobic, blue: hydrophilic areas)
cut1-6 Iso-potential cuts of the molecular surface (PIMM88-structure only) sliced along constant potentials to identify the hydrogen bond donor (AH) unit (MEP > +12.0 kcal/mol, red), the H-bond acceptor (B) portion (MEP < -12.0 kcal/mol, blue or green), and the hydrophobic binding region X (yellow-brown, MLP > 0.04) as the AH-B-X-system of sweetness. The large blue surface section represents the most hydrophilic molecular region (dark blue, MLP < -0.002) encompassing the AH-B-couple.

For details see:

Molecular Modeling of Saccharides, Part III. Sucrose, Sucralose, and Fructose: Correlations Between Hydrophobicity Potential Profiles and AH-B-X Assignments. F. W. Lichtenthaler and S. Immel, in: Sweet Taste Chemoreception (Eds.: M. Mathlouthi, J. A. Kanters, and G. G. Birch), Elsevier Appl. Science, London/New York, 1993, pp. 21-53.
Abstract

Top of Page High-Potency Sweeteners
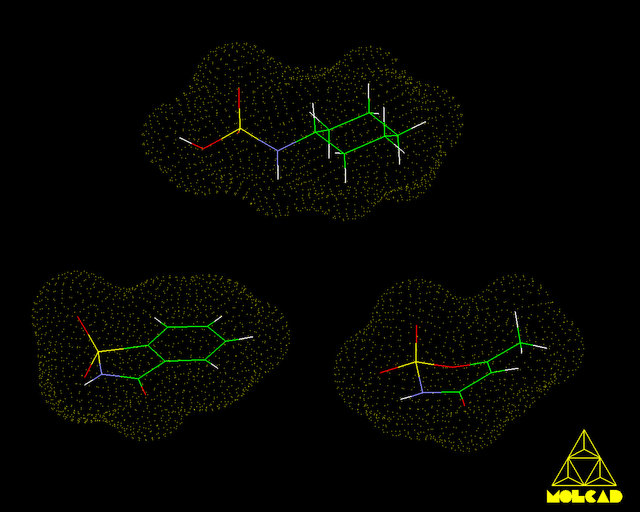
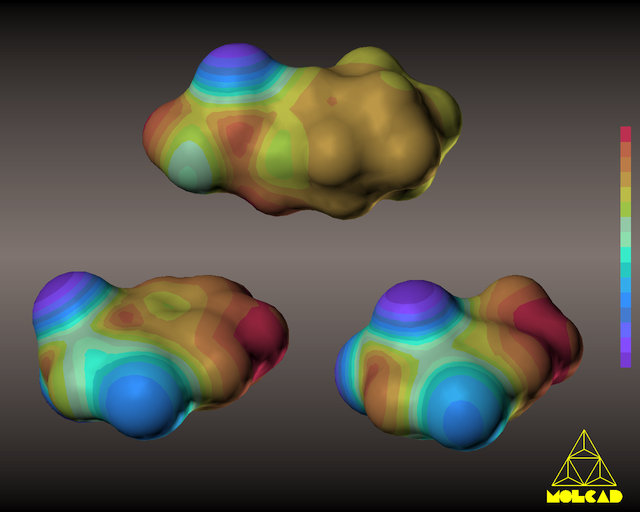
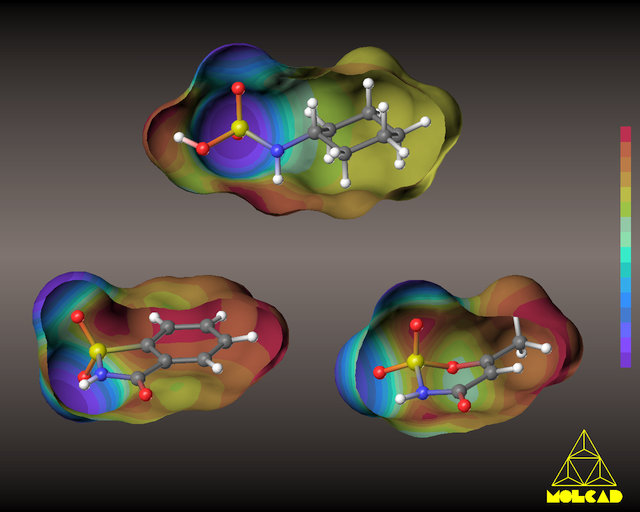
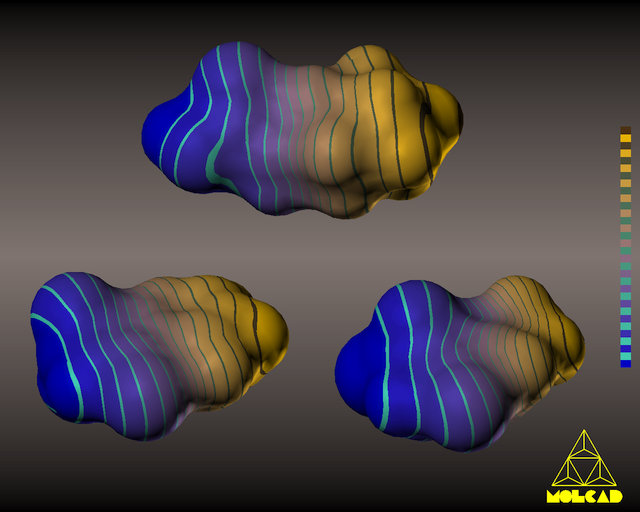
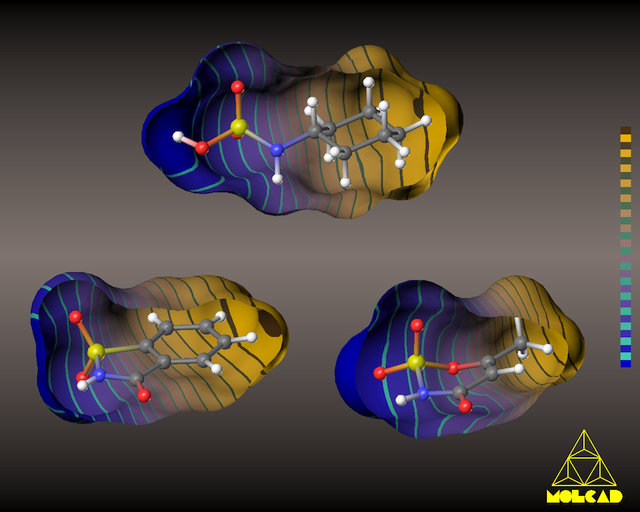
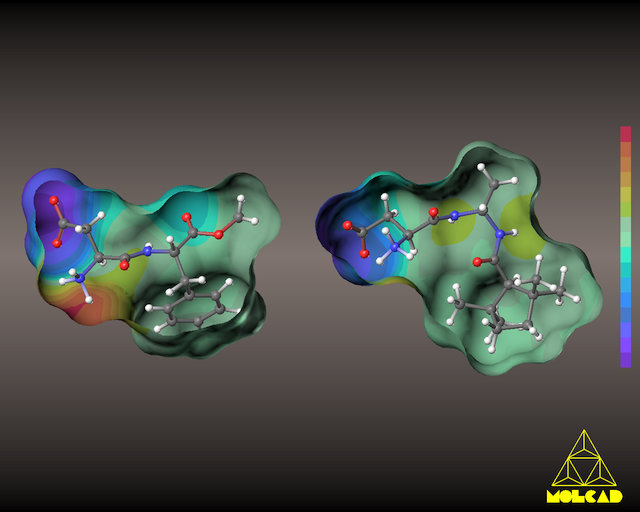
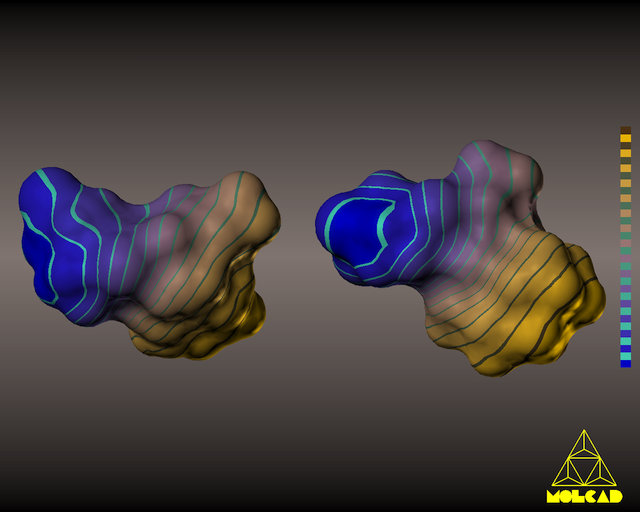
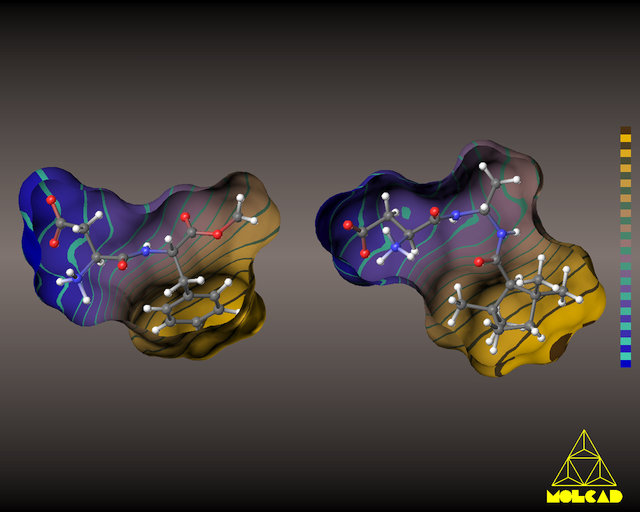
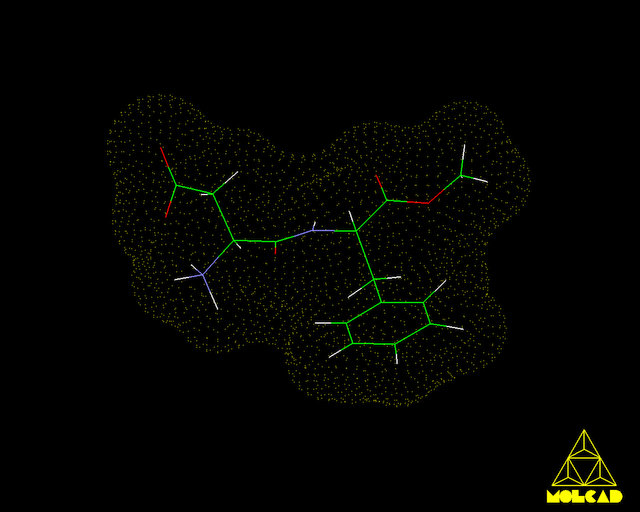
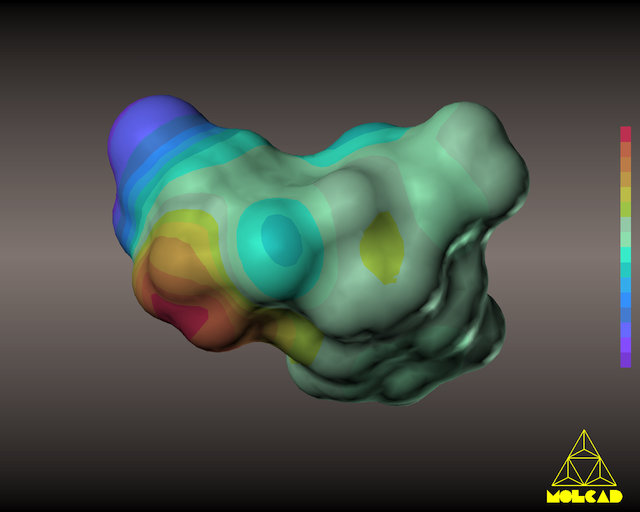
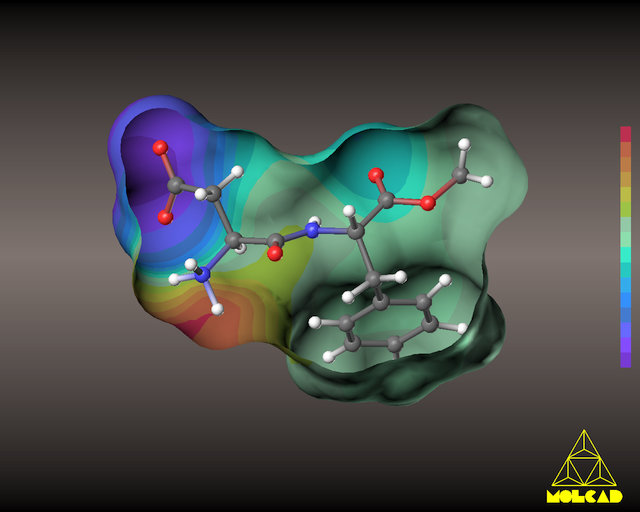
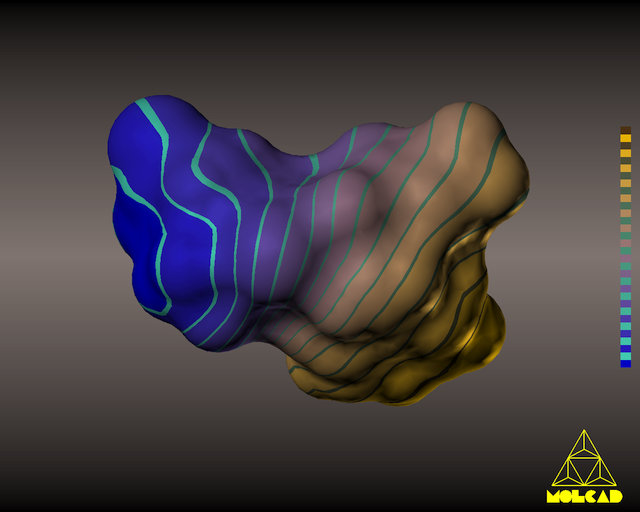
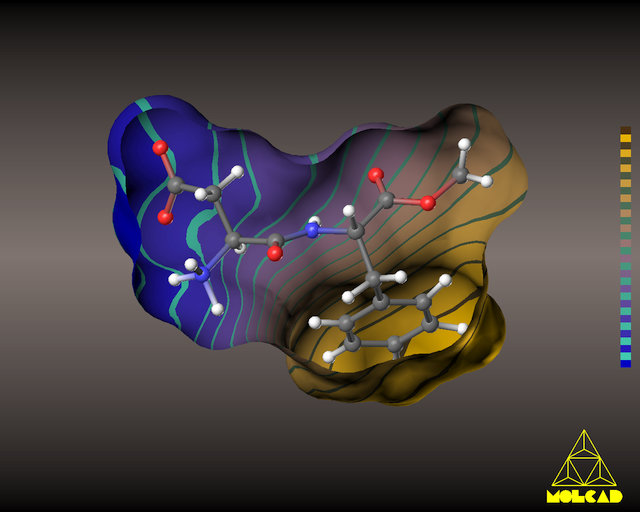
Cyclamate, Saccharine, Acesulfame, Aspartame, and a Retro-Inverso-Sweetener

Cyclamat, Saccharine, and Acesulfame
Click for larger graphics! Click for larger graphics! Click for larger graphics! Click for larger graphics! Click for larger graphics!
sld mep1 mep2 mlp1 mlp2
Aspartame and a Retro-Inverso-Sweetener
Click for larger graphics! Click for larger graphics! Click for larger graphics! Click for larger graphics! Click for larger graphics!
sld mep1 mep2 mlp1 mlp2
Aspartame
Click for larger graphics! Click for larger graphics! Click for larger graphics! Click for larger graphics! Click for larger graphics!
sld mep1 mep2 mlp1 mlp2

Image Notes
sld Molecular surfaces - all solid-state structures
mep Molecular electrostatic potential profiles (MEP, red: positive, violet: negative potentials), AM1 atomic charges
mlp Molecular lipophilicity patterns (MLP, yellow-brown: hydrophobic, blue: hydrophilic areas)

For details see:

Molecular Modeling of Saccharides, Part III. Sucrose, Sucralose, and Fructose: Correlations Between Hydrophobicity Potential Profiles and AH-B-X Assignments. F. W. Lichtenthaler and S. Immel, in: Sweet Taste Chemoreception (Eds.: M. Mathlouthi, J. A. Kanters, and G. G. Birch), Elsevier Appl. Science, London/New York, 1993, pp. 21-53.
Abstract

© Copyright PD Dr. S. Immel

Close Box Move Box Close Box
Click and drag the box, double-click to close floating window.