| TUD Organische Chemie | Immel | MolArch+ | Examples | View or Print (this frame only) |
This page gives you an overview on the different examples contained in the MolArch+ distribution.
You may also use the non-frames version of this documentation.
General Remarks
|
To use the different examples you need to create a temporary working directory, change to this directory, copy the example files from the $MOLARCH/examples installation directory and gunzip them.
|
Example 1
|
Various basic viewing commands and options available with MolArch+ (These are not the high-quality renderings generated with POVRAY, we will learn about these latter).
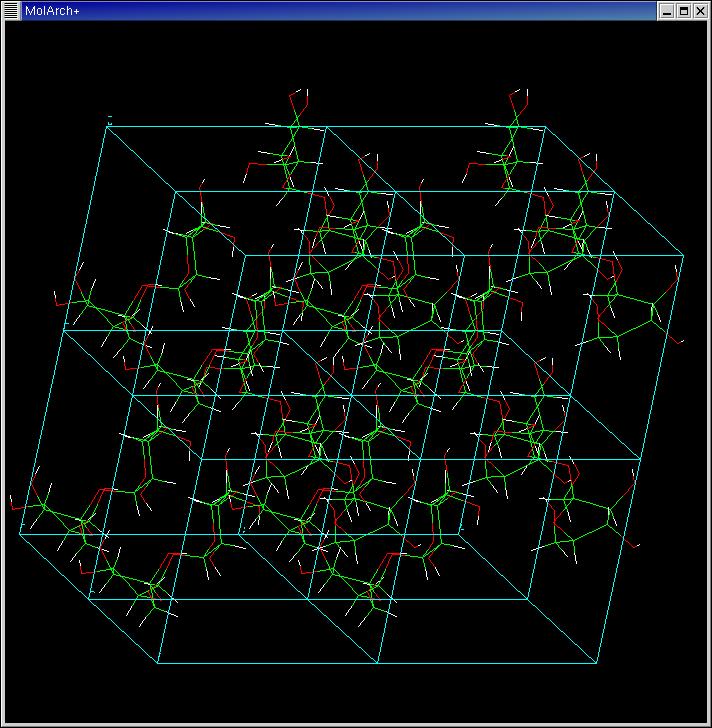
This example visualizes the solid-state structure of sucrose.
|
Example 2
|
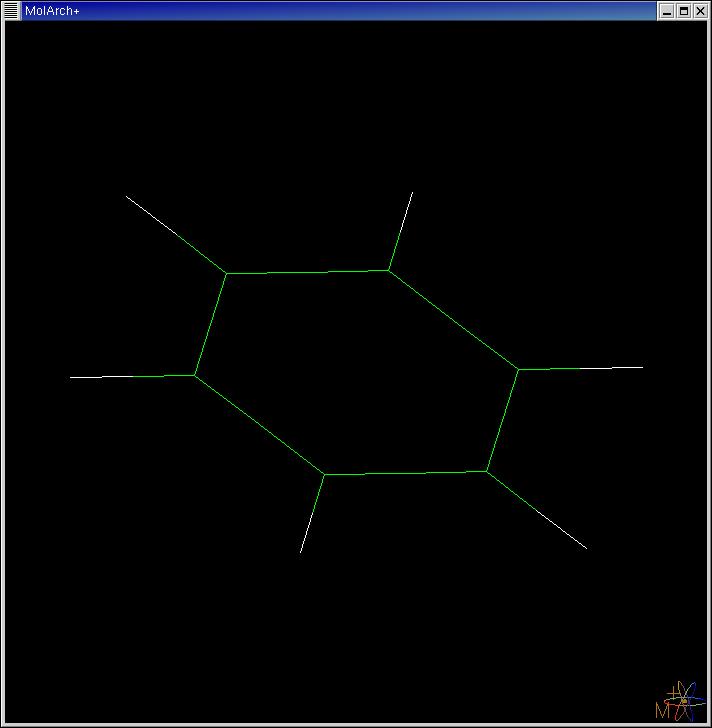
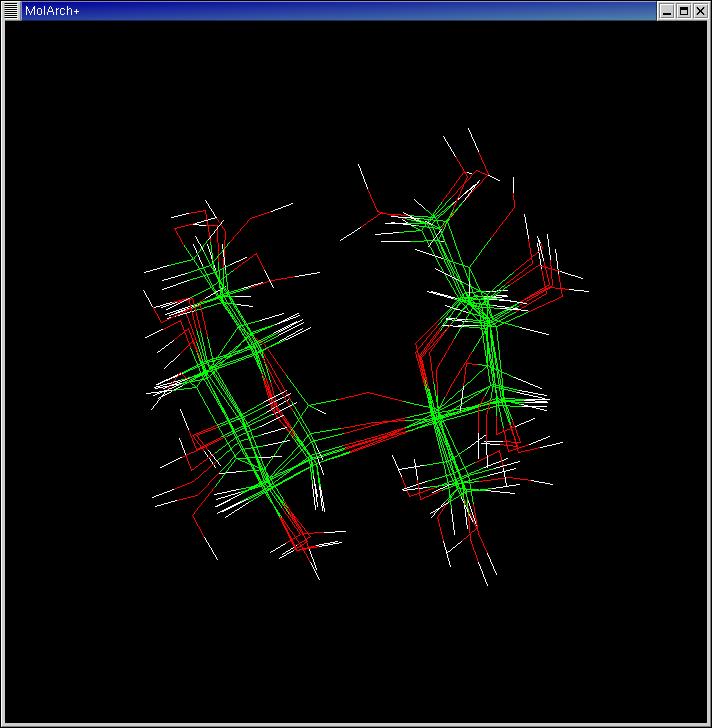
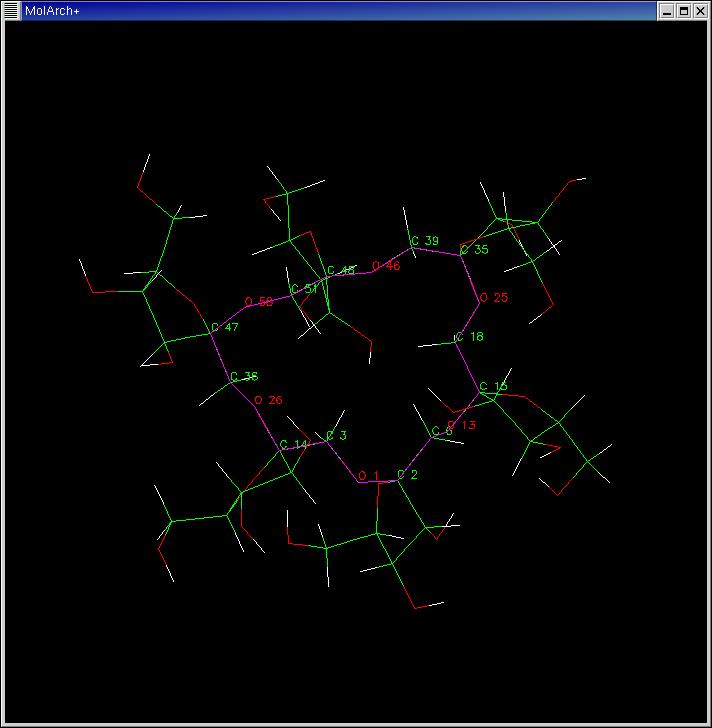
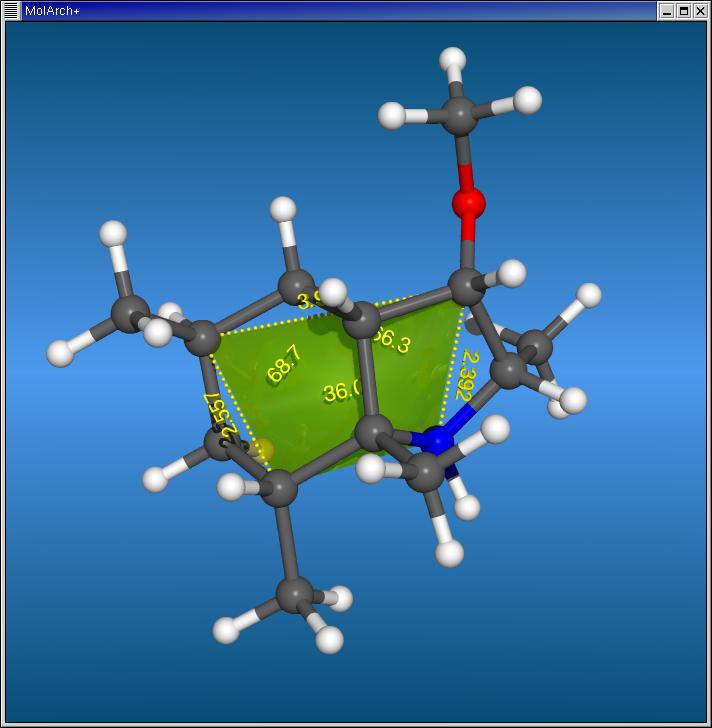
Basic geometry analysis and geometry manipulations exemplified for a cyclofructin molecular structure.
|
Example 3
|
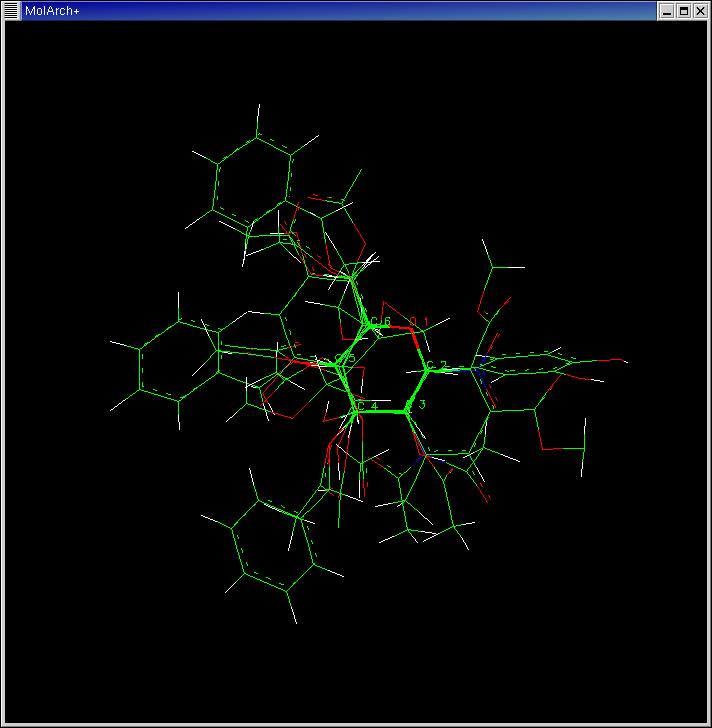
Advanced 3D fitting of molecular sub-structures and fragments visualized for some pyranose solid-state structures.
|
Example 4
|
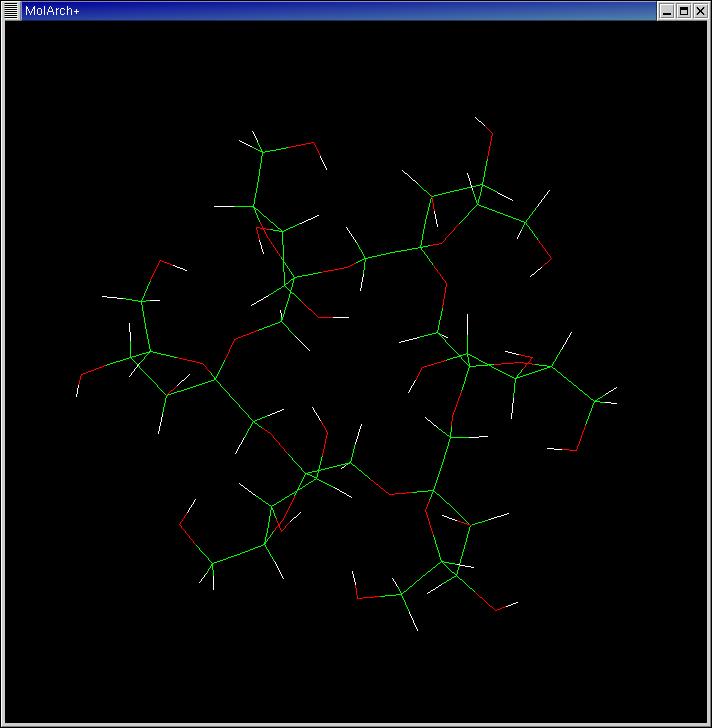
Energy weighted structure analysis demonstrated for a series of sucrose conformations.
|
Example 5
|
Energy weighted structure analysis demonstrated for a series of cyclofructins, with multiple geometry parameters for each molecular conformation.
|
Example 6
|
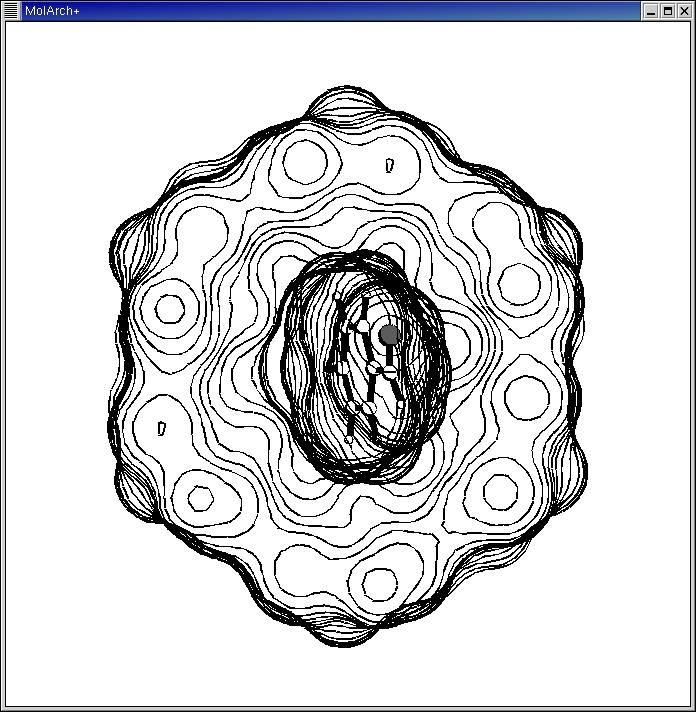
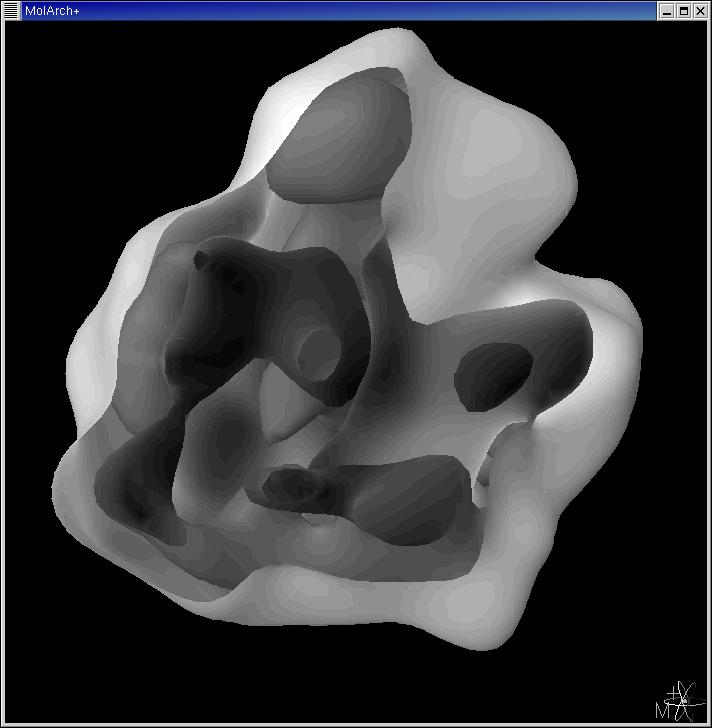
Viewing options and slicing of molecular surfaces demonstrated for a cyclodextrin inclusion complex.
This example also demonstrates the use of the molview+ and molconv+ programs to create high-resolution black-and-white graphics.
|
Example 7
|
Black-and-white models of a very large surface (ribosome).
This example also demonstrates the use of the molview+ and molconv+ programs to create high-resolution black-and-white graphics.
|
Example 8
|
This example demonstrates how to create high-resolution color graphics using POVRAY. You need to have POVRAY V3.5 properly installed and configured for use with MolArch+.
In case of problems please check the MolArch+ - Parameter Files and Settings and
MolArch+ - Error Messages.
|
General Remarks
|
To use the different examples you need to create a temporary working directory, change to, copy the corresponding files from the $MOLARCH/examples installation directory and gunzip them.
The examples listed here demonstrate how to create high-resolution color graphics using POVRAY. You need to have POVRAY V3.5 properly installed and configured.
In case of problems please check the MolArch+ - Parameter Files and Settings and
MolArch+ - Error Messages. For details on the MolArch+ commands used and their syntax see the MolArch+ script files ("*.spr").
|
Atomic Orbitals
|
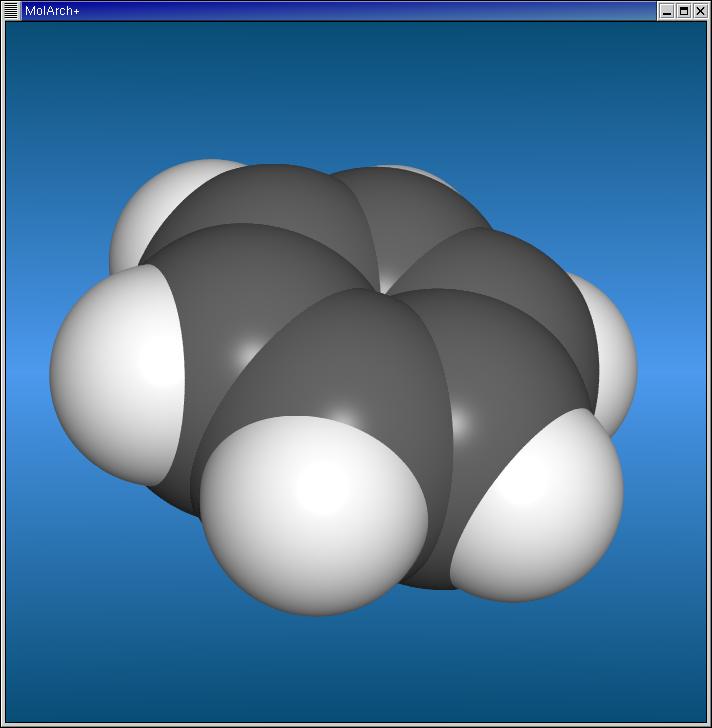
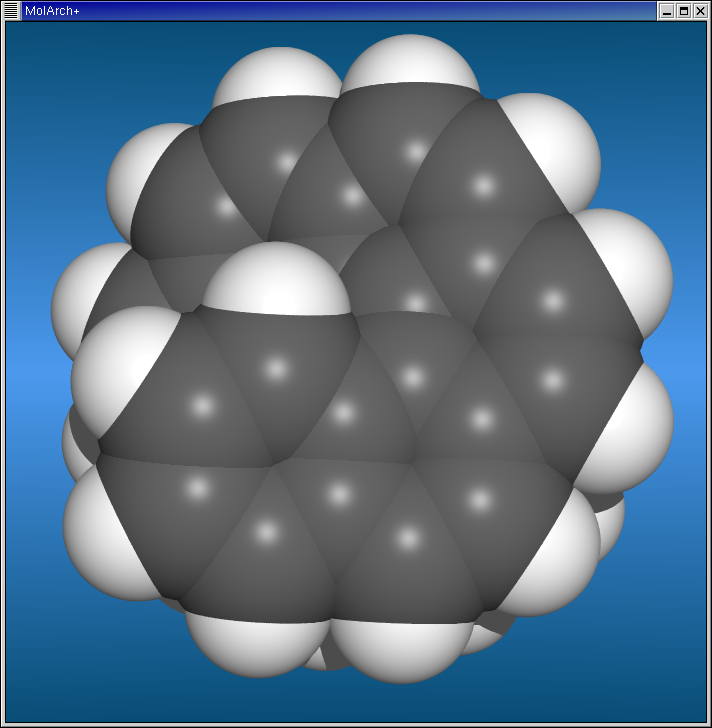
Schematic atomic orbital representations of benzene:
	cp $MOLARCH/examples/benzol.* $MOLARCH/examples/benzol?.* .
	gunzip benzol.* benzol?.*

	molarch++ --pdbload benzol.pdb --sprload benzol1.spr
or molarch++ --pdbload benzol.pdb --sprload benzol2.sprTest the following sequence of commands to obtain high-resolution POVRAY color graphics: triangles set display 0.5 set povray camera automatic POVRAY ball transparency 0.75(Each keyword and command may be abbreviated by the first three letters only!) |
Iso-contours
|
Iso-contour surfaces from benzene SCF data (GAUSSIAN cube file):
	cp $MOLARCH/examples/benzol_SCF.* .
	gunzip benzol_SCF.*

	molarch+ --sprload benzol_SCF.spr
(See above for commands to create high-resolution POVRAY color graphics) |
Molecular Orbitals
|
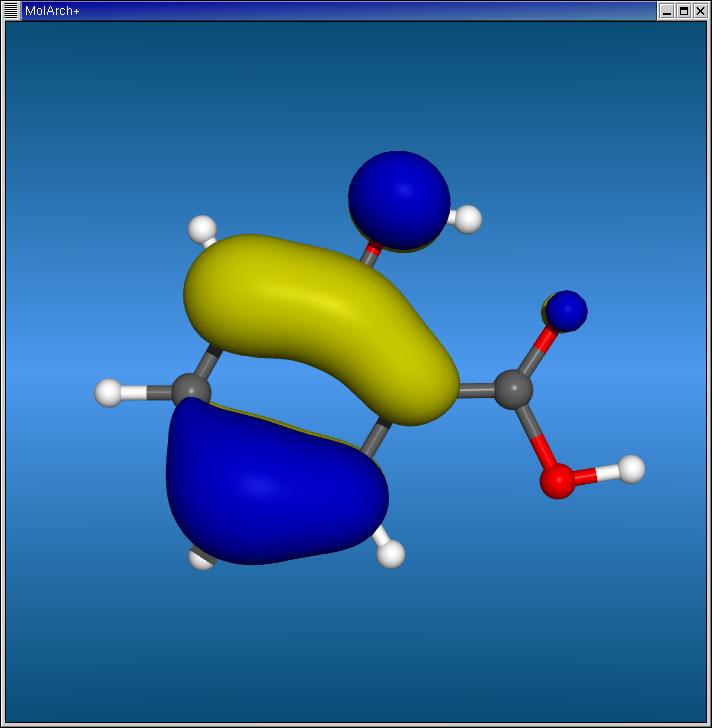
Highest occupied orbital (HOMO) from GAUSSIAN cube files (solid iso-contour-surface type orbitals):
	cp $MOLARCH/examples/homo.cub.gz .
	gunzip homo.cub.gz

	molarch+ --cubload homo.cub \
		 --calculate existing homo.cub both contours 1 -0.04 gaussian
(The LUMO orbital is also included as lumo.cub in the examples, see below!) |
Transparent Orbitals
|
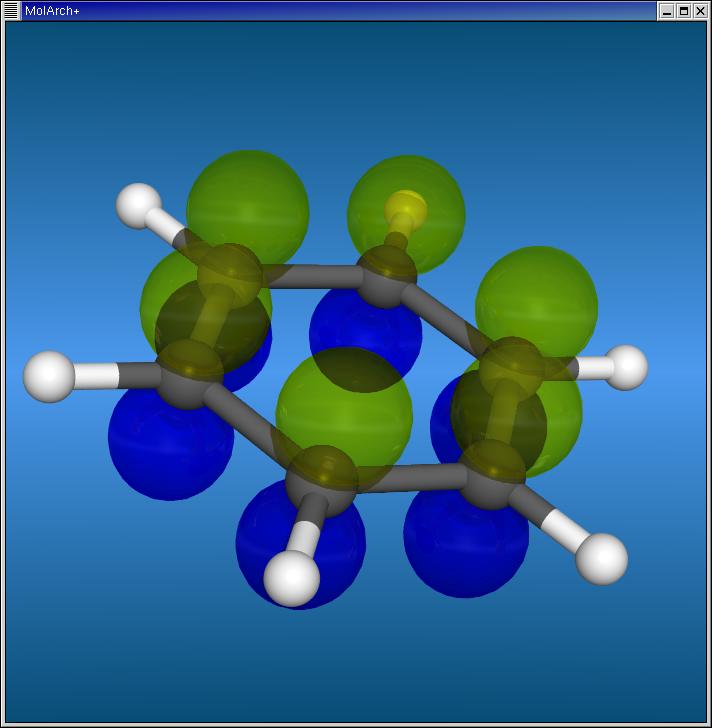
Lowest unoccupied orbital (LUMO) from GAUSSIAN cube files (transparent orbital representations since MolArch+ V7.30!):
	cp $MOLARCH/examples/lumo.cub.gz .
	gunzip lumo.cub.gz

	molarch+ --cmap coldensityYB.par mep \
                 --cubload lumo.cub grid 1 skip 10 contours 15 cmap mep \
			align crop 2.5 \
                 --unit-cell off --set povray sky on --set povray shadows off \
                 --set povray reflection off --set povray camera auto \
                 --set display-offset 1.5 --set homogeneous-bonds on \
                 --POVRAY ball
(The HOMO orbital is also included as homo.cub in the examples, see above!)
|
Quality Mapping
|
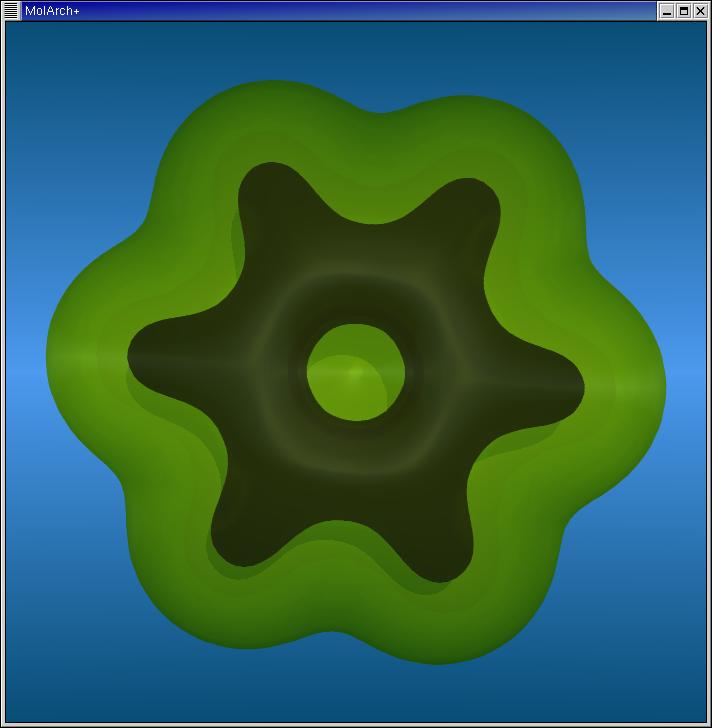
GAUSSIAN cube grid data may be mapped as a quality onto molecular Connolly-type surfaces. If your cube grid contains the electrostatic potential around a molecule, this will
yield the molecular electrostatic potential on its surface. In this example, the density value of the HOMO is mapped onto that surface (if this is physically reasonable in this case may be a matter of debate).
	cp $MOLARCH/examples/homo.cub.gz .
	gunzip homo.cub.gz

	molarch++ --cubload homo.cub grid 1 skip 3 --calculate connolly \
		  --qadd cube --show sld --unit 1 1 1 \
		  --triangles --zclip 25% \
		  --set povray camera automatic --set povray shadows off \
		  --set grid off --POVRAY ball
(Please note that because of the very large cube grid data file this example uses the molarch++ program instead of molarch+!) |
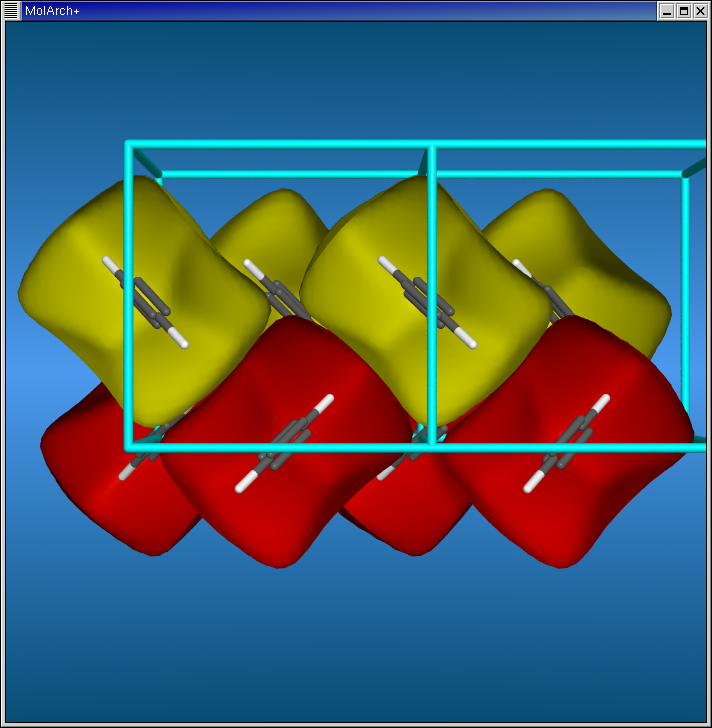
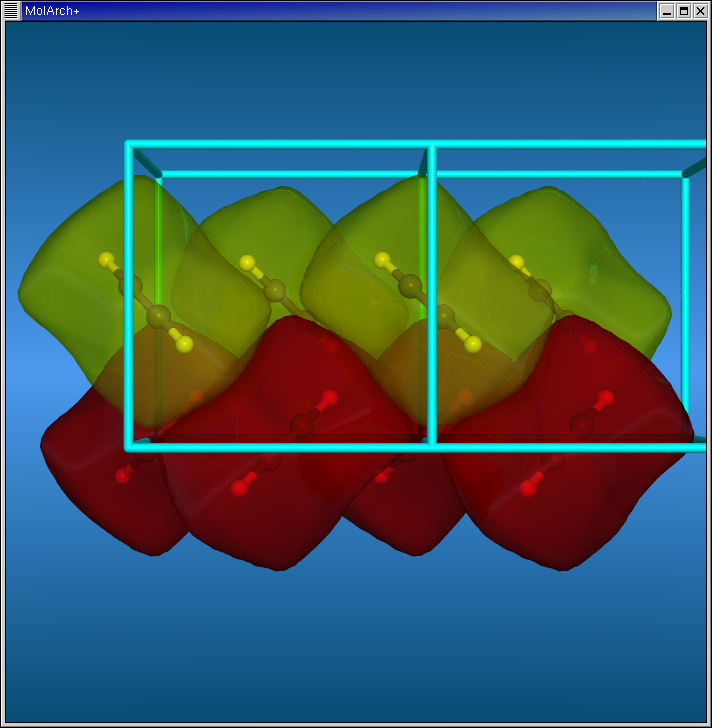
Hirshfeld Surfaces
|
Calculate Hirshfeld surfaces for crystal lattices as exemplified for the solid-state structure of acetylene:
	cp $MOLARCH/examples/acetylene.dat.gz .
	cp $MOLARCH/examples/acetylene.spr.gz .
	gunzip acetylene.*

	molarch+ --datload acetylene.dat \
		 --calculate crystal step 0.25 regression 1 mol 1 offset 3 \
		 --calculate crystal step 0.25 regression 1 mol 2 offset 3 \
		 --calculate crystal step 0.25 regression 1 mol 3 offset 3 \
		 --calculate crystal step 0.25 regression 1 mol 4 offset 3 \
		 --save sld acetylene1.sld 1 \
		 --save sld acetylene2.sld 2 \
		 --save sld acetylene3.sld 3 \
		 --save sld acetylene4.sld 4

	molarch+ --sprload acetylene.spr --zclip 50% \
		 --set povray camera automatic --set povray shadows off \
		 --set display 0.5 --POVRAY capped
(The first molarch+ command calculates and saves the surfaces to external files, the second command creates the scene to be rendered.) |
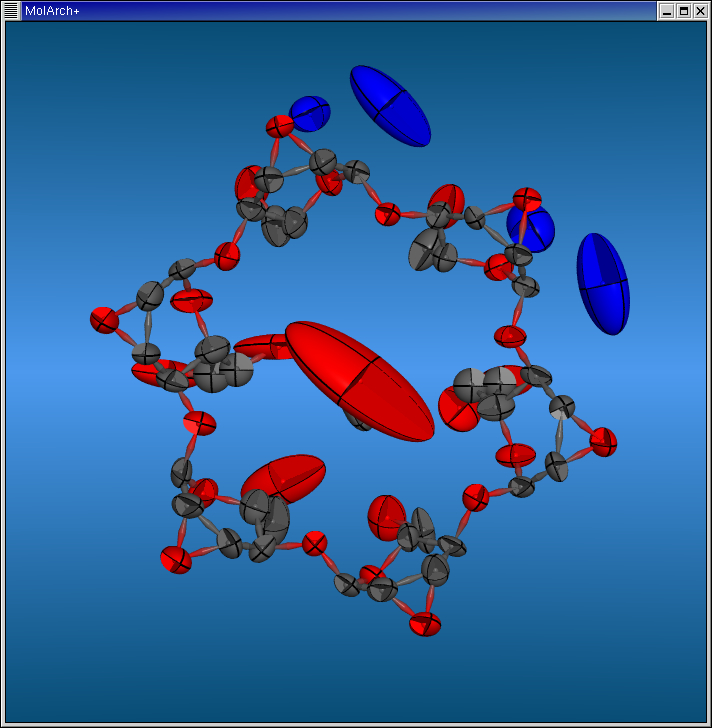
Crystal Structures
|
This is an example on how to display atomic anisotropic thermal ellipsoids read from crystallographic CIF-files.
	molarch+ --cifload $MOLARCH/examples/EXAMPLE1.cif.gz asymmetric ellipsoids \
		 --unit-cell off --delete hydrogens all --relabel water \
		 --set povray camera automatic --set povray shadows off \
		 --set homogeneous-bonds on --POVRAY ball
(Please note that in this example the CIF-file is not manually unzipped, but molarch+ is doing this automatically if attempting to load a gzipped file!) |
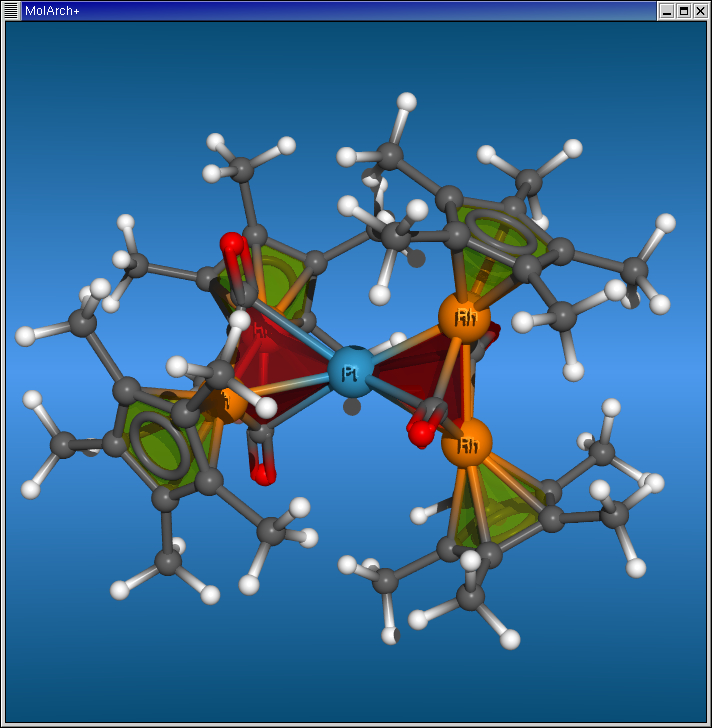
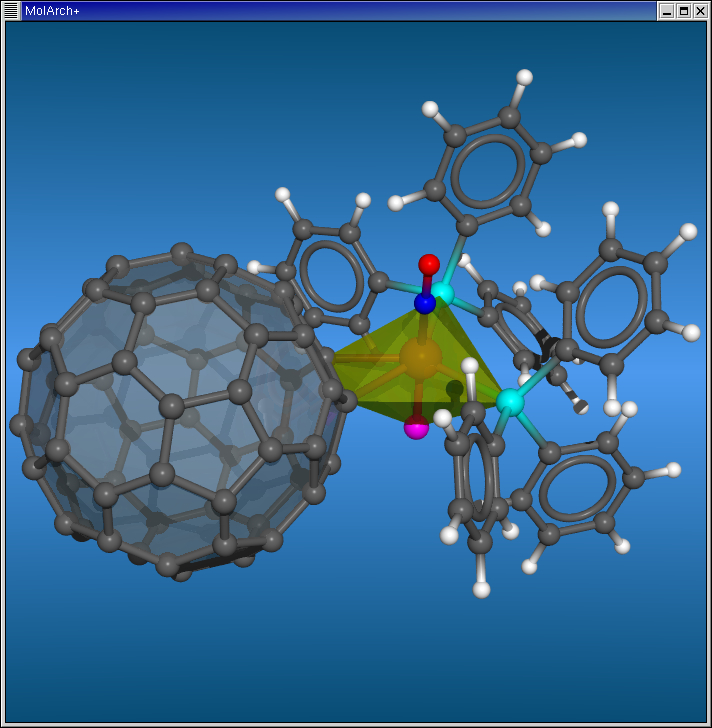
Polyhedrons
|
On the MolArch+ - Images page you will find a number of examples visualizing complex coordination polyhedrons
that were generated using the MolArch+ program. The corresponding MolArch+ script files are
included in the $MOLARCH/examples installation directory (files named 'polyhedrons<n>.*' with <n> currently ranging from 01 - 20).
These examples may be executed with the following commands:
	cp $MOLARCH/examples/polyhedrons<n>* .
	gunzip polyhedrons<n>.*

	molarch+ --spr polyhedrons<n>.spr
where <n> currently ranges from 01 - 20. These complex geometries were taken from the CCDC Cambridge Crystallographic Data Base of solid-state structures. |
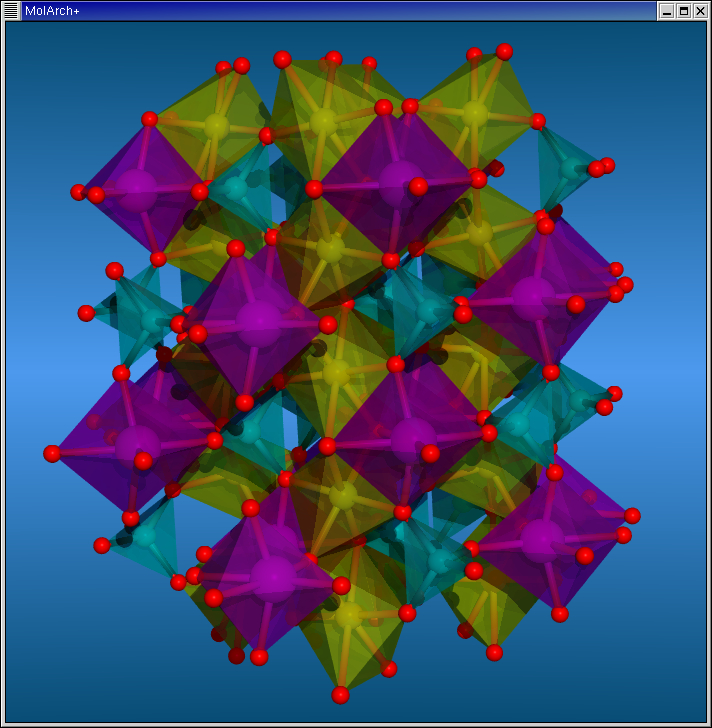
Inorganics
|
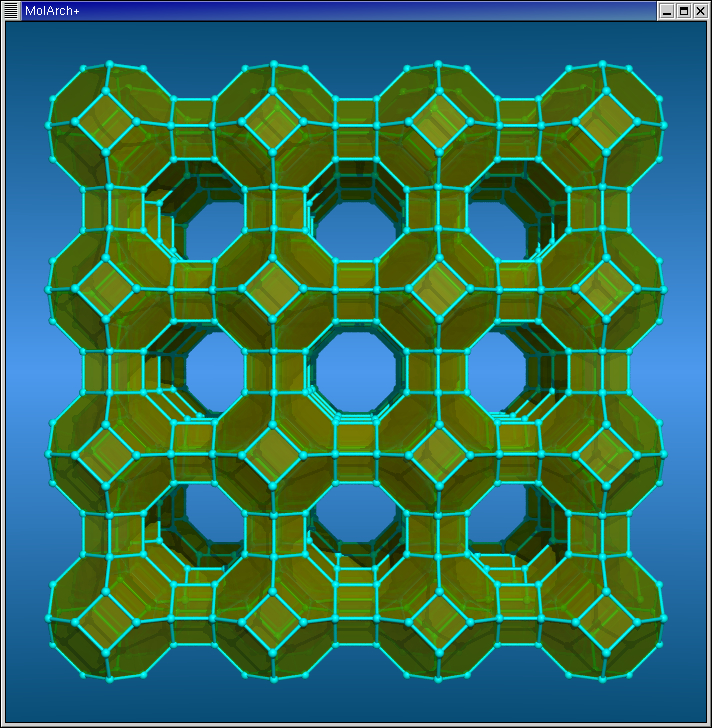
On the MolArch+ - Images page some typical inorganic structures are displayed using
MolArch+ and POVRAY. The corresponding MolArch+ script files are
included in the $MOLARCH/examples installation directory (files named 'inorganic*'.
These examples may be executed with the following commands:
	cp $MOLARCH/examples/inorganic* .
	gunzip inorganic*

	molarch+ --spr <filename>.spr
where <filename>.spr is one of following files: 'inorganic_CuInOPO4.spr', 'inorganic_diamond.spr', 'inorganic_graphite.spr', 'inorganic_quartz.spr', 'inorganic_zeolite1_large.spr', 'inorganic_zeolite1.spr', 'inorganic_zeolite2_large.spr', or 'inorganic_zeolite2.spr'. |
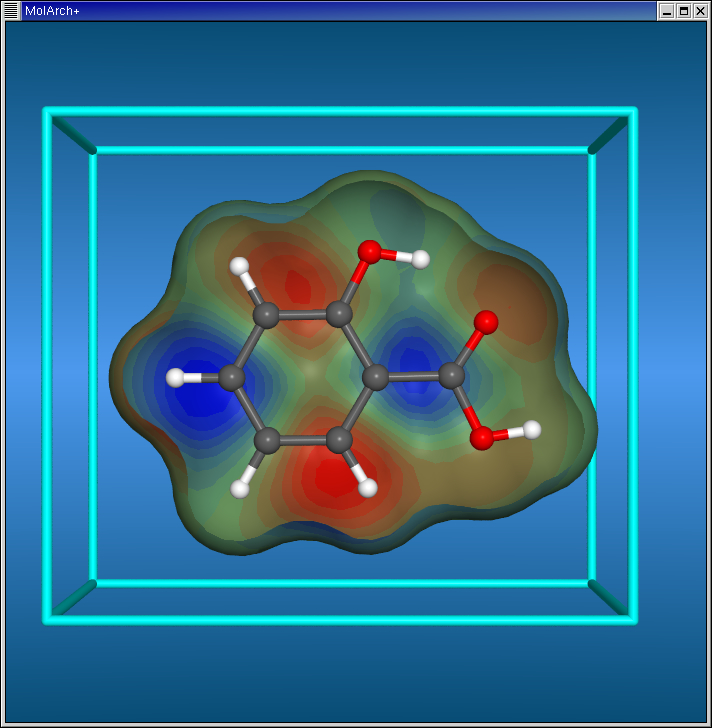
Density Contours
|
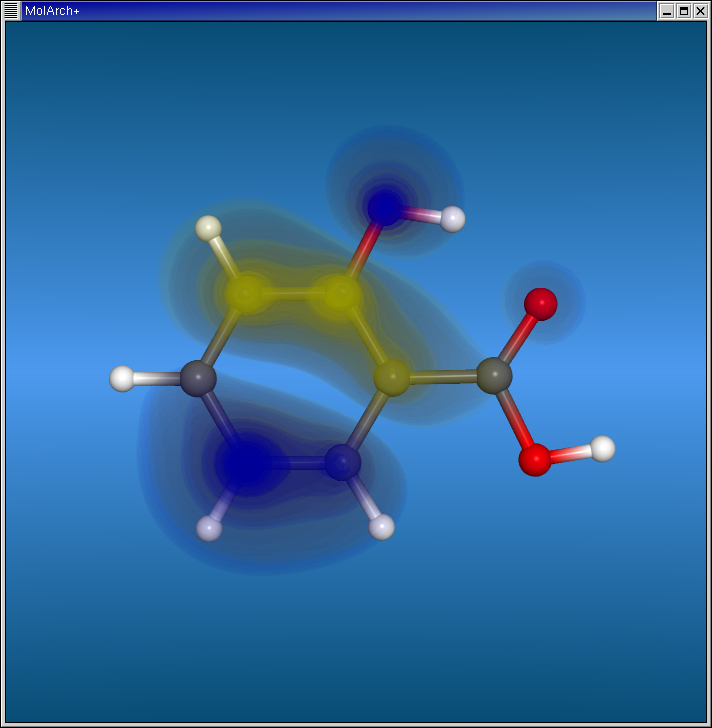
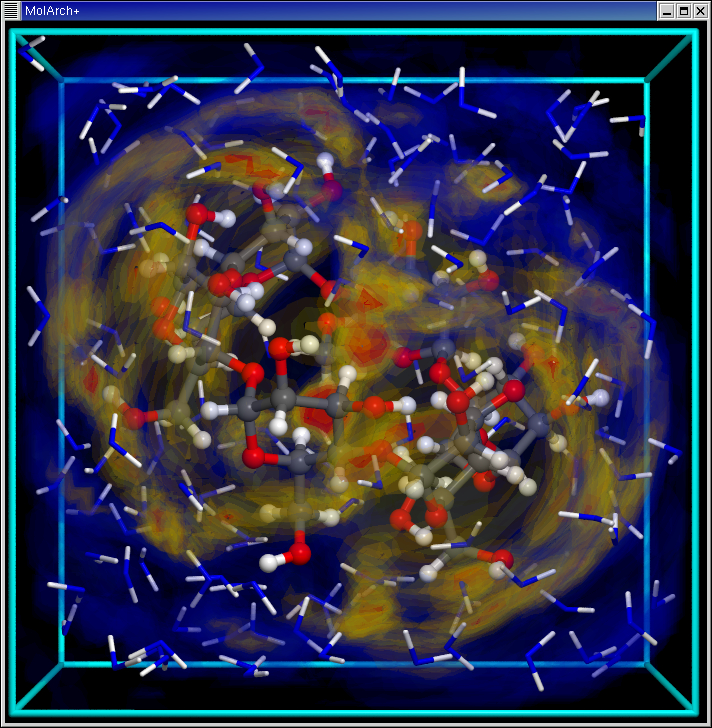
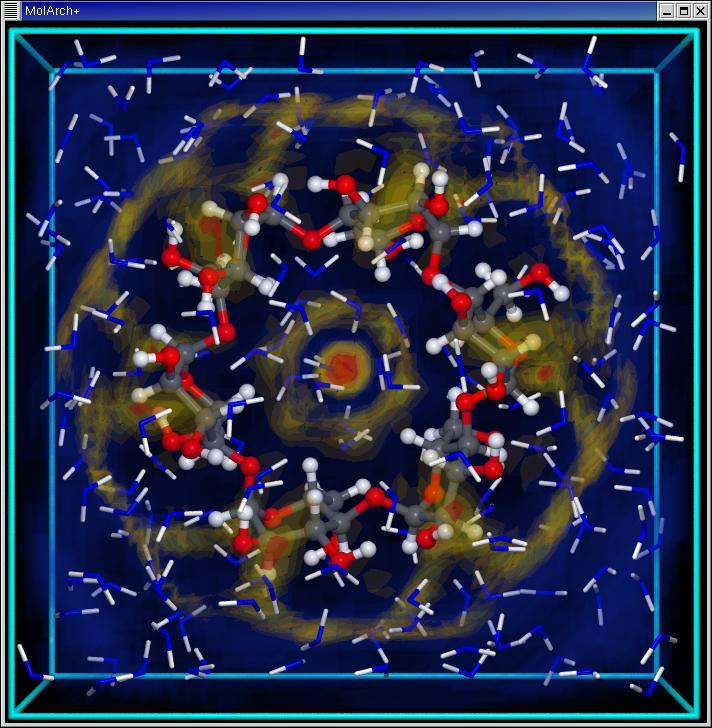
This is an example on the display and rendering of transparent density contours using MolArch+.
	cp $MOLARCH/examples/density* .
	gunzip density*

	molarch+ --spr density1.spr
	molarch+ --spr density2.spr
This will produce two POVRAY files which may be rendered using the following statements: povray +Q10 +W300 +H300 +A +P +X +DO -V -title 'MolArch+' -Idensity1.pov povray +Q10 +W300 +H300 +A +P +X +DO -V -title 'MolArch+' -Idensity2.povPlease note that rendering of these high-quality transparent density contours may take some time. MolArch+ itself is not able to display the contours, but it may be used to set up the corresponding POVRAY files. |
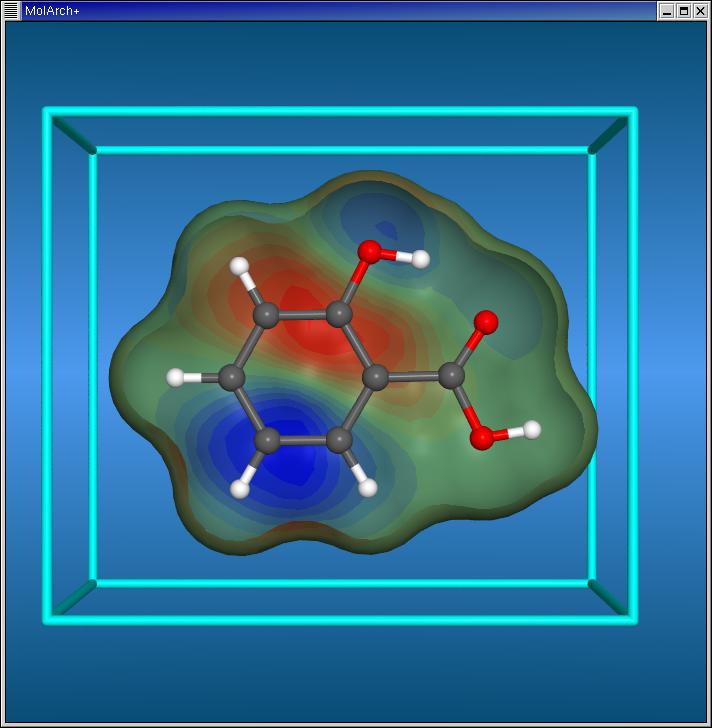
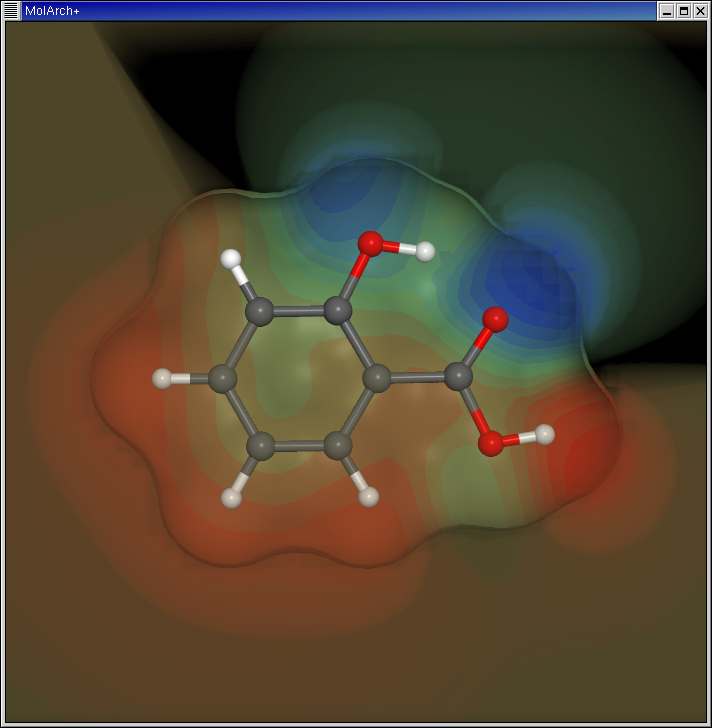
Potential Contours
|
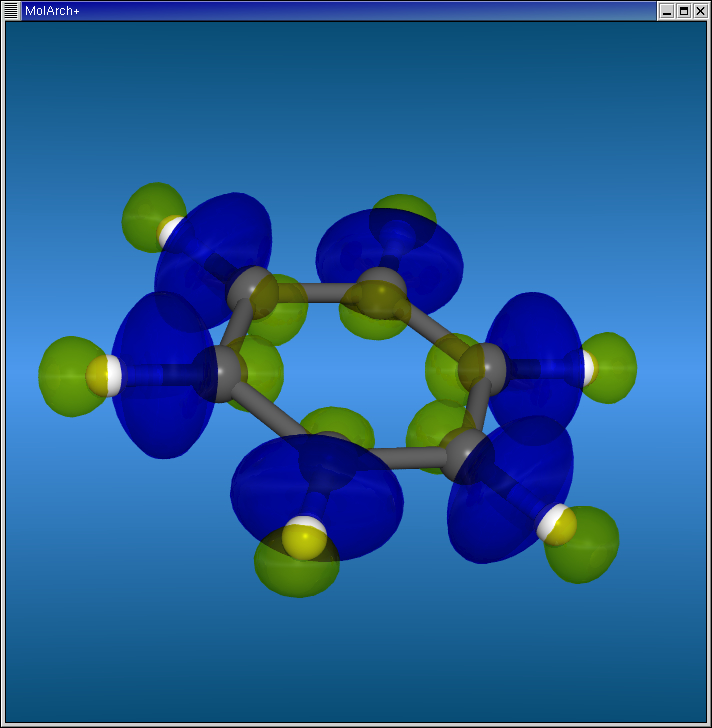
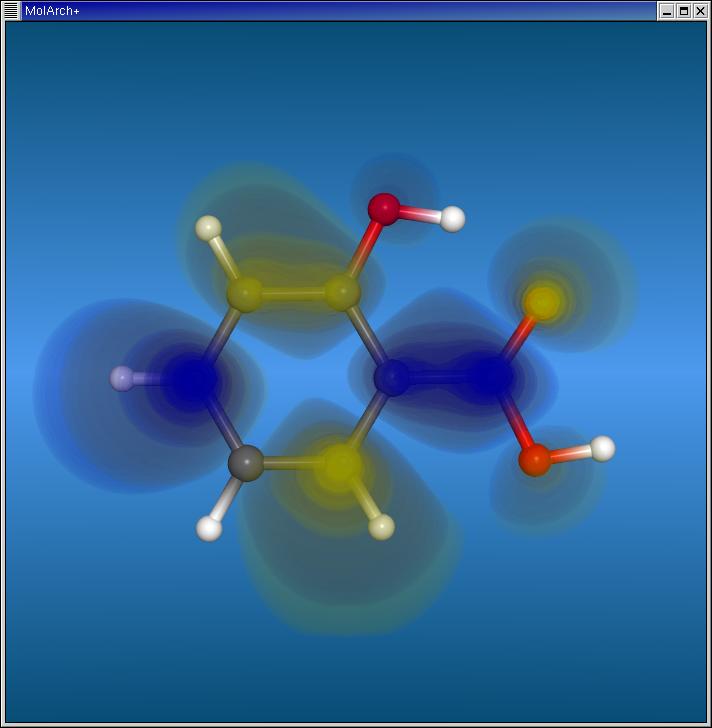
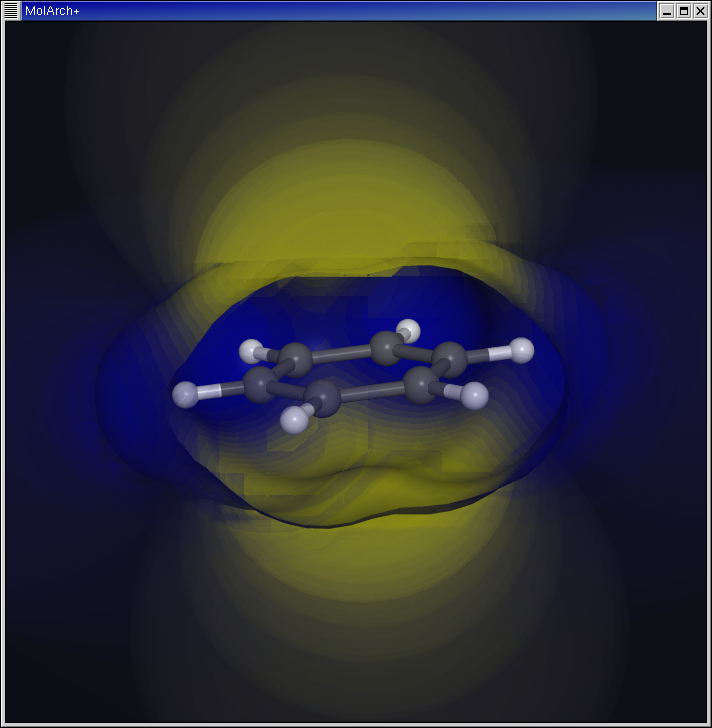
This is an example on the display and rendering of 3D molecular electrostatic potentials as transparent contours using MolArch+.
	molarch+ --cmap colorrib.col mep --cmap coltransparentrib3.par mlp \
		 --cinv MEP --cinv MLP \
		 --pdb $MOLARCH/examples/benzol.pdb.gz --esp --sld \
		 --qdelete mep \
		 --cube calculate mode mep offset 5.5 points 50 \
			contours 16 cmap mlp align xcrop 5.5 ycrop 5.5 \
			zcrop 3.5 default 0.0 exclude-surface minimum -40 \
		 --qadd cube --unit off \
		 --set povray sky off --set povray shadows off \
		 --set povray reflection off --set pov camera auto \
		 --set display 1.5 --view 1 2 4 6 5 3 --rot x -75 --rot y -20 \
		 --triangles --zclip 25% \
		 --save POVRAY benzol.pov ball \
		 --exit
This will produce a POVRAY file which may be rendered using the following statements: povray +Q10 +W300 +H300 +A +P +X +DO -V -title 'MolArch+' -Ibenzol.povPlease note that rendering of these high-quality transparent density contours may take some time. MolArch+ itself is not able to display the contours, but it may be used to set up the corresponding POVRAY files. |
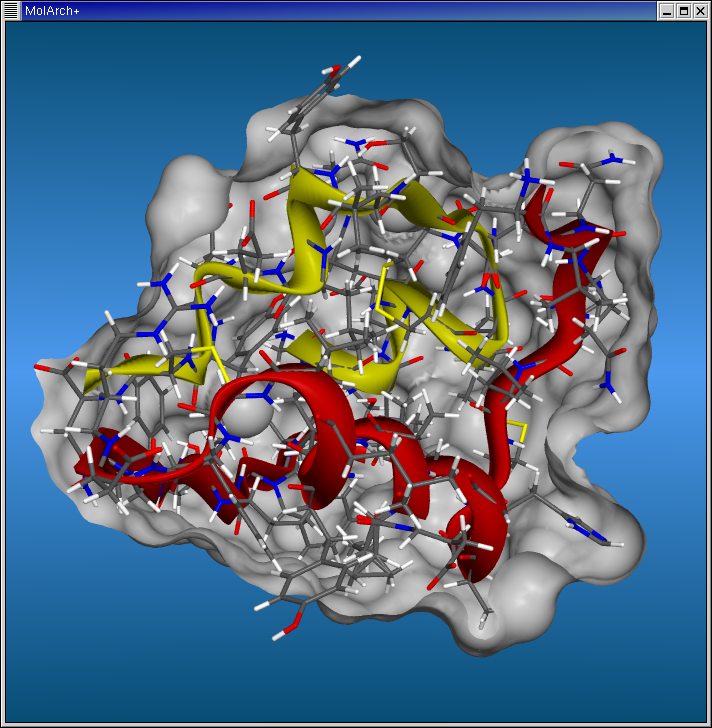
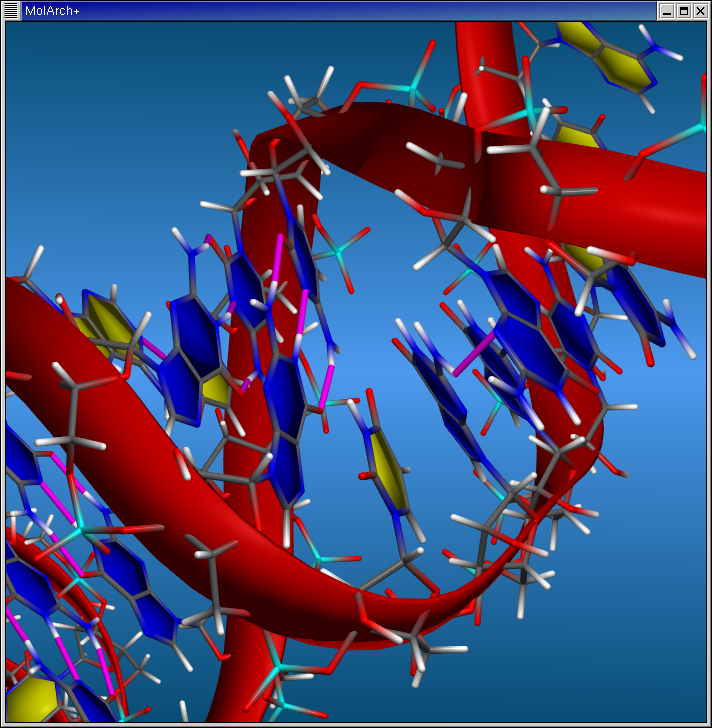
Ribbon Models
|
On the MolArch+ - Images page you will find a number of examples visualizing ribbon models for various molecules
such as proteins, cyclopeptides, DNA, RNA, and non-proteins. Some MolArch+ script files that were used to generate these images are
included in the $MOLARCH/examples installation directory (files named 'ribbon<n>.*' with <n> currently ranging from 01 - 05).
These examples may be executed with the following commands:
	cp $MOLARCH/examples/ribbon<n>* .
	gunzip ribbon<n>.*

	molarch+ --spr ribbon<n>.spr
where <n> currently ranges from 01 - 05. The protein and RNA structures were taken from the Protein Data Base. |
General Remarks
|
The gzipped archive files contained in the $MOLARCH/examples/movies installation directory contain the structure files, numerous shell scripts ("*.com"), and MolArch+ script files ("*.spr")
that where used to create the animations and movies listed in the "molecular movies" section of this web-site. Copy these archives to a
temporary working directory, un-archive them, and check the shell-scripts ("*.com" files) for details. These scripts give an outline how structure fitting and interpolation, multiple bonds,
POVRAY settings, and many other things are handled by MolArch+. These scripts may be particularly useful for rendering animations of chemical reactions and conformational changes of molecules.
In some cases you will need only structure files for the first and the last molecular configuration along a reaction coordinate, and MolArch+ will do the interpolation to create smooth animations;
in other cases you may need the transition state or other molecular geometries along the reaction pathway in addition.
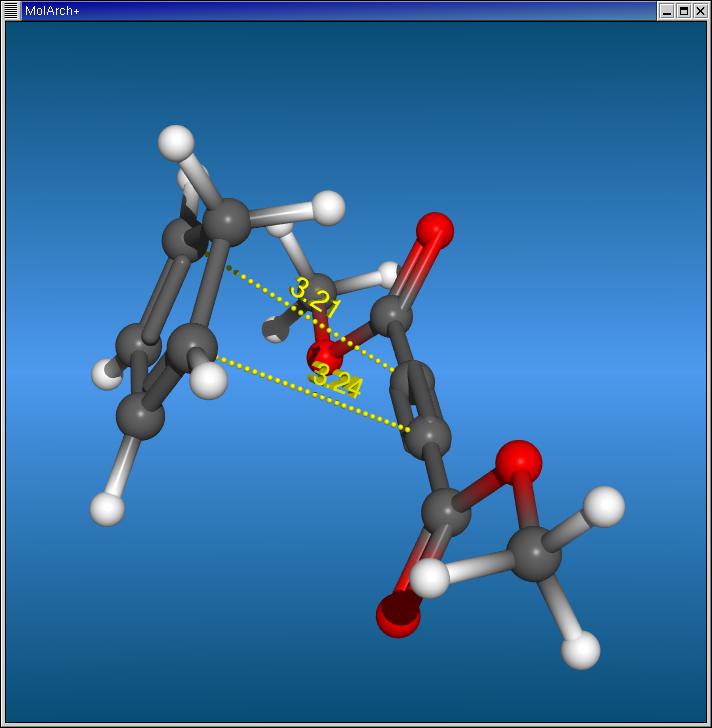
A good start is to look at the files contained in $MOLARCH/examples/movies/diels-alder0.tar.gz, which where used to render the Diels-Alder reaction of cyclopentadiene and acetylene dicarboxylic acid dimethyl ester.
    	gunzip -c $MOLARCH/examples/movies/diels-alder0.tar.gz | tar -xvf -
	cd diels-alder0
	ls -l
	more diels-alder.com
All animations basically follow the same scheme:
These animations may be used for the presentation of molecular reactions and many other things. I would be more than grateful if you could drop me a note on your animations if you have made them publicly available on the net. |