| TUD Organische Chemie | Immel | Tutorials | Orbitals | Molecular | Methane | View or Print (this frame only) |
The molecular orbitals (MOs) of molecules can be constructed by linear combination of atomic orbitals (LCAO).
Though the exact Schrödinger equation is unsolvable for many electron systems such
as molecules, the solution can be numerically approximated by ab initio or density functional (DFT) theory.
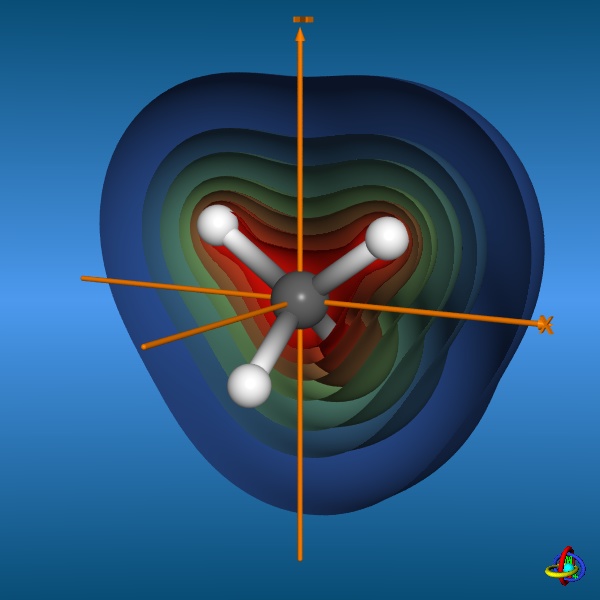
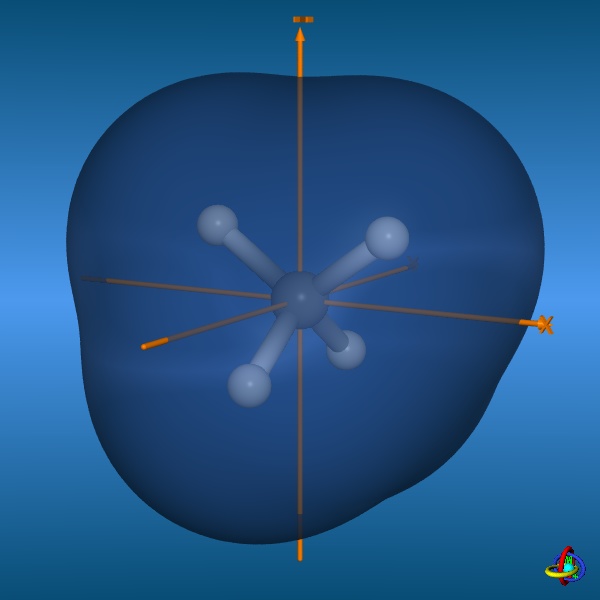
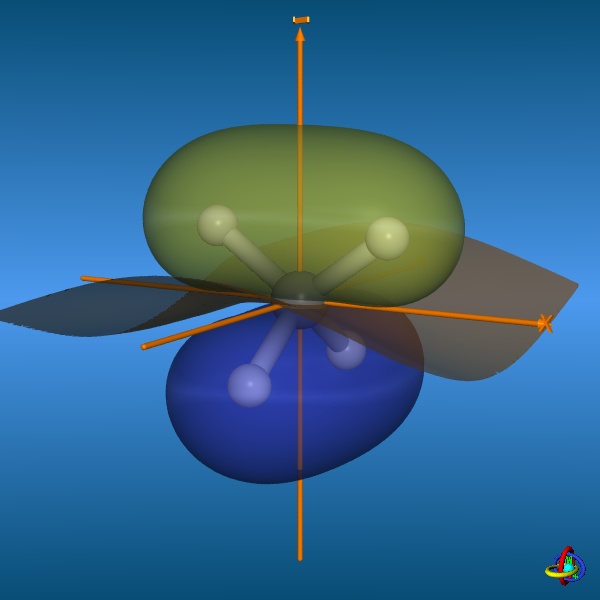
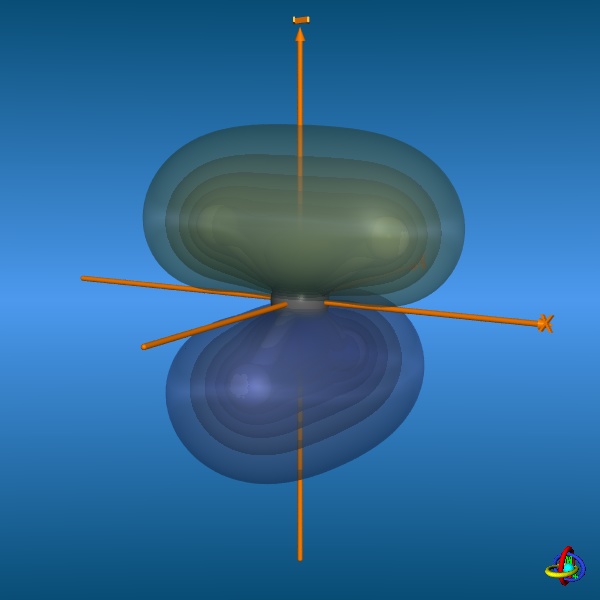
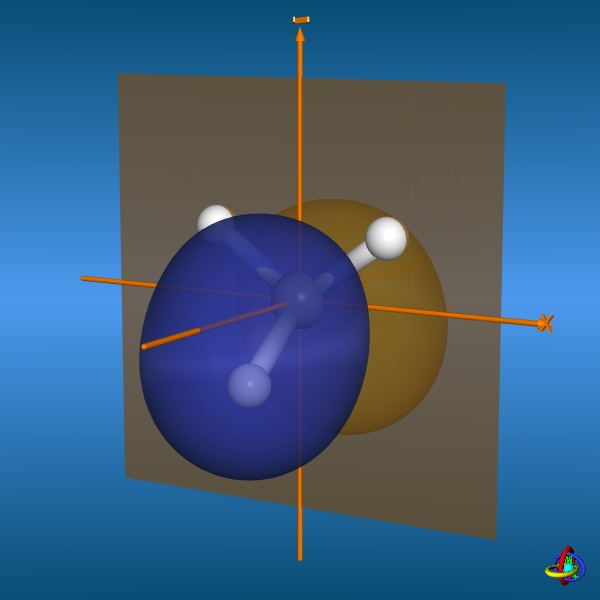
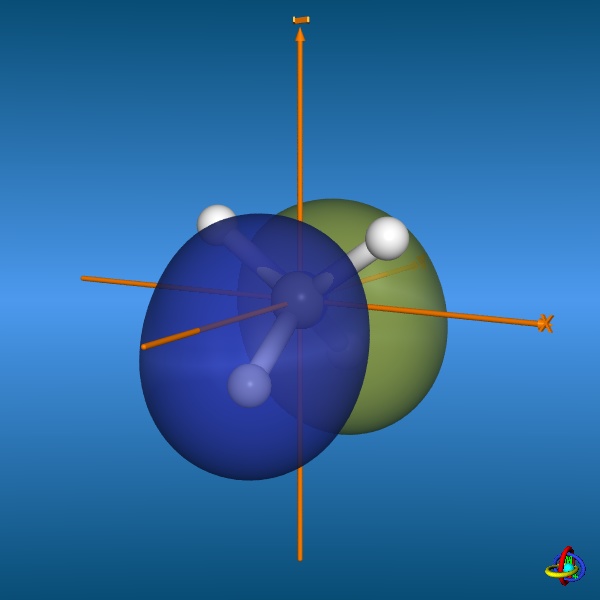
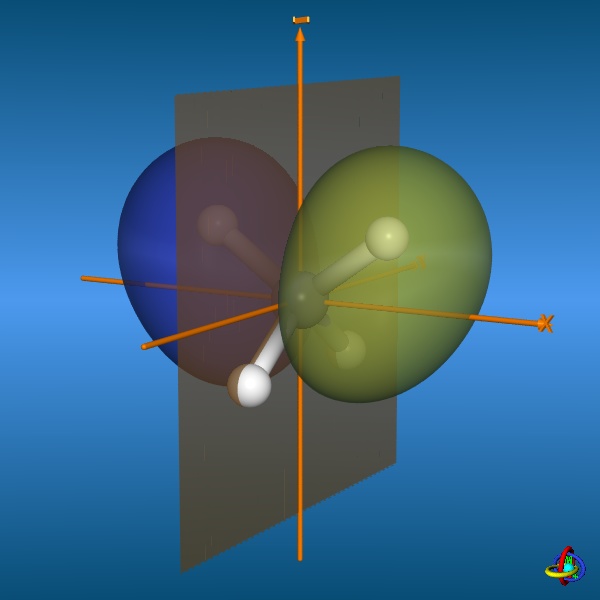
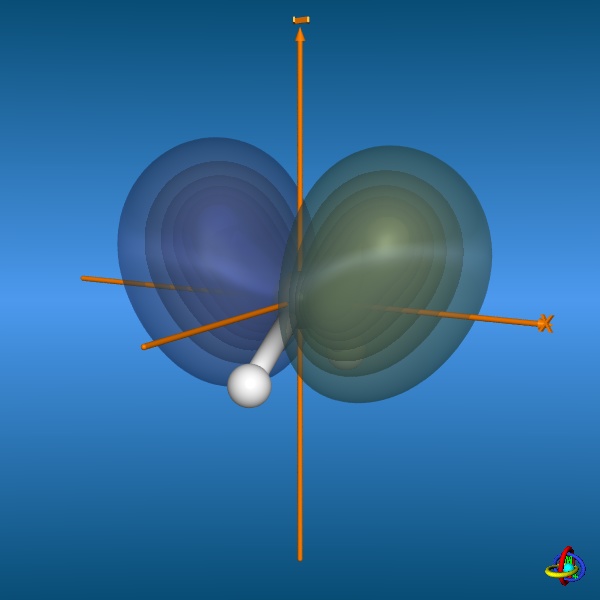
This page gives an overview on the molecular orbitals of methane calculated by DFT methods using a B3LYP/6-311++G** basis set. All MO representations are 90% or 90-25% iso-contour probability surfaces of the electron density (ψ2), i.e. they resemble the spatial volume around the nuclei of the molecule in which the electrons are found with the corresponding certainty. The different colors (yellow and blue) represent regions with opposite sign of the wave function ψ; nodal planes (not necessarily real "planar" planes) were ψ passes through zero and changes sign are indicated in orange.
Click on the small images below with blue background below to obtain an enlarged view - the images with black background provide links to the corresponding 3D-models (VRML-type models); these links will open in a new window. |
|
||||||||||||||||||||||||||||||||||||||||||||||||
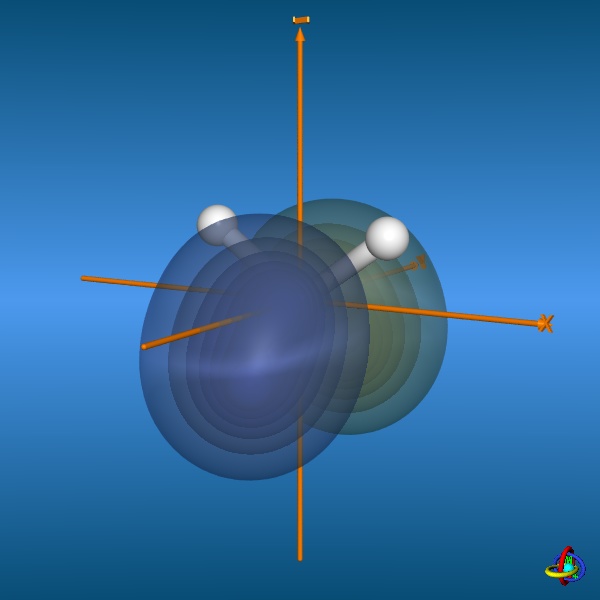
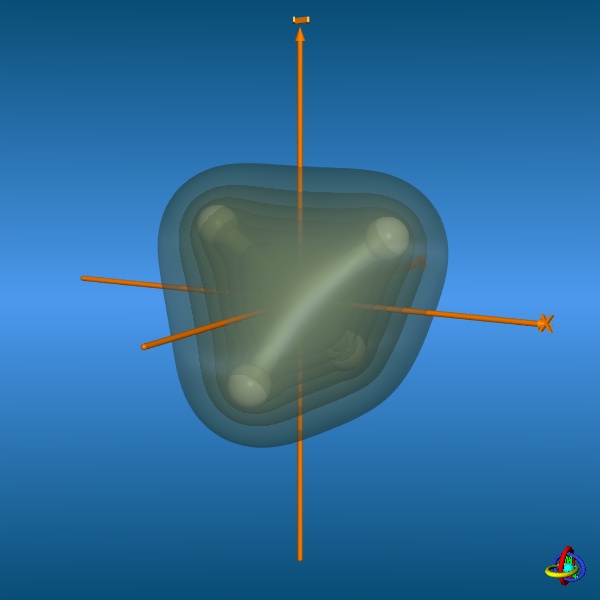
The total electron density (clipped 99, 95, 90, 80, 70, 60, and 50% iso-density contours depicted on the right) render the molecule with its characteristic shape
(note the different iso-contour values of the MO orbitals and the total electron density contours).
|
|
||||||||||||||||||||||||||||||||||||||||||||||||
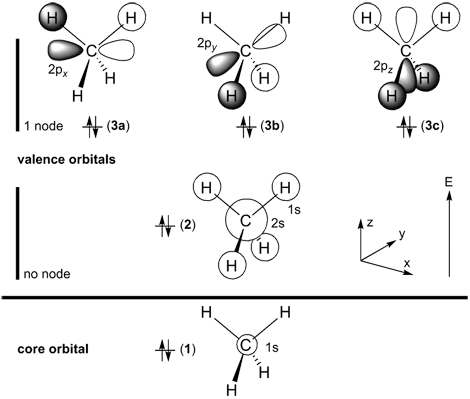
Below on the right, the schematic drawing indicates the major contributions of atomic orbitals (AOs) to the molecular orbitals (MOs) of methane.
With increasing energy of the orbitals (from bottom to top), the number of nodal planes (not necessarily real "planar" planes) increases and the symmetry decreases.
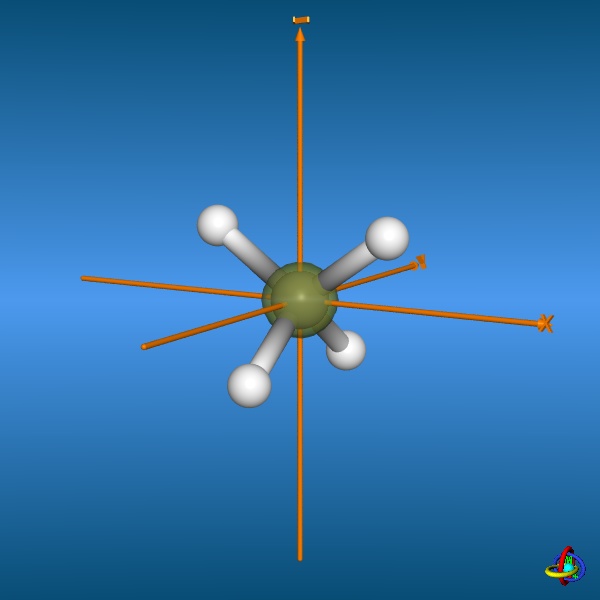
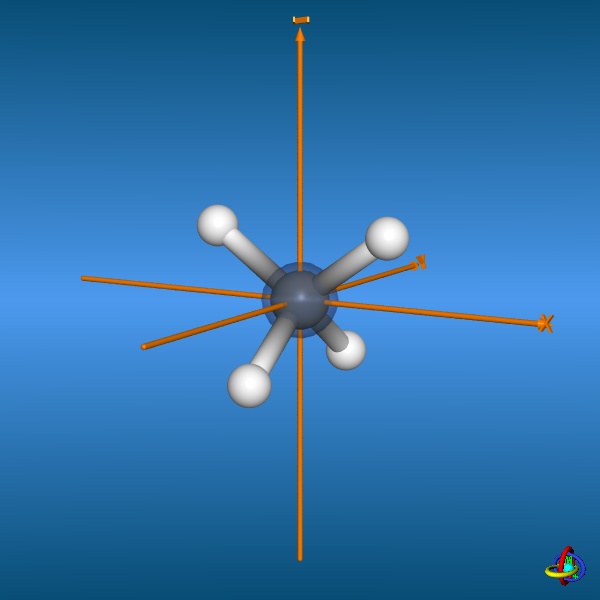
For methane, there are 10 electrons (CH4, 6 + 4×1 = 10 electrons) and five occupied orbitals. The lowest-energy orbital is the 1s-carbon core orbital (two electrons),
the remaining four valence MOs are constructed from the carbon
2s,
2px,
2py,
2pz, and hydrogen
1s-orbitals.
The highest occupied molecular orbitals (HOMOs) are three-fold degenerate, i.e. all three orbitals 3a, 3b, and 3c have equal energy.
Further informations on AOs are available from the gallery of hydrogenic orbitals and hybrid orbitals.
The thumbnail images on the left provide access to enlarged graphics as well as 3D-models (VRML) of the orbitals, respectively. All images and models are scaled relative to each other, and their sizes can be compared directly, only the 1s-carbon core orbital has been expanded by a factor of 1.5. |
|||||||||||||||||||||||||||||||||||||||||||||||||
Notes: a) Orbital number (see scheme on the right, degenerate orbitals with equal energy are denoted by same numbers); b) Label (symmetry descriptor in parenthesis); c) Nodal planes (ψ = 0.0); d) 90% Probability contours of MO electron density (ψ^2); e) 90, 80, 70, 60, 50, 40, and 25% Probability contours; f) 3D-Models require a VRML plugin to be installed (large files with sizes between 50-2000 KBytes). The size of the carbon 1s-core orbital has been expanded by a factor of 1.50. |
|
||||||||||||||||||||||||||||||||||||||||||||||||
For a more detailed description of atomic orbitals see the corresponding gallery of orbitals.
All graphics and iso-contour surfaces shown on this page were created using the MolArch+ program
and POVRAY Persistence of Vision Raytracer. Electron densities were calculated
on three dimensional grids for the corresponding molecules using the JAGUAR program.
|
|||||||||||||||||||||||||||||||||||||||||||||||||