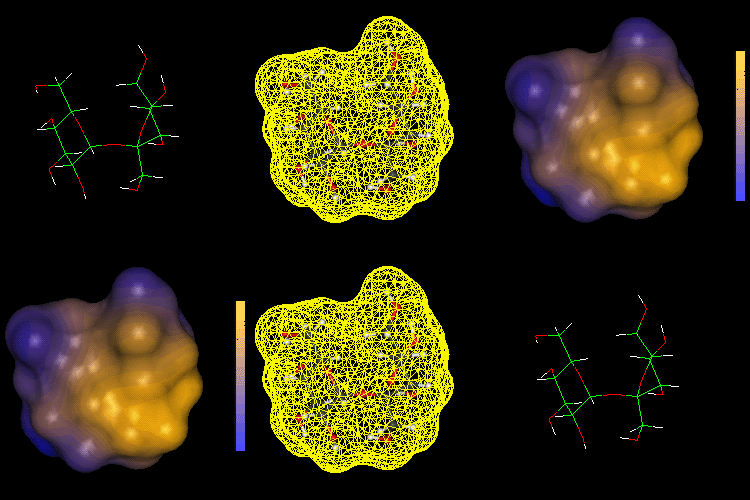
| TUD Organische Chemie | Immel | Graphics | MolArch+ | Animations | Lipophilicity Pattern of Sucrose | View or Print (this frame only) |
 |

|
References
[1] |
(a) H. J. Lindner, PIMM88 - Closed Shell PI-SCF-LCAO-MO- Molecular Mechanics Program, Technical University of Darmstadt, 1988. - (b) H. J. Lindner, Tetrahedron 1974, 30, 1127-1132. - (c) A. E. Smith, Ph.D. Thesis, Technical University of Darmstadt, 1989. - (d) A. E. Smith and H. J. Lindner, J. Comput.-Aided Mol. Des. 1991, 5, 235-262. |
[2] |
(a) J. Brickmann, MOLCAD - MOLecular Computer Aided Design, Technical University of Darmstadt, 1992. The major part of the MOLCAD program is included in the MOLCAD-module of the SYBYL package of TRIPOS Associates, St. Louis, USA. - (b) J. Brickmann and M. Waldherr-Teschner, Labo (Hoppenstedt Verlag, Darmstadt) 1989, 10, 7-14; Informationstechnik (Oldenburg Verlag, Muenchen) 1991, 33, 83-90. - (c) J. Brickmann, J. Chim. Phys. 1992, 89, 1709-1721. - (d) M. Waldherr-Teschner, T. Goetze, W. Heiden, M. Knoblauch, H. Vollhardt, and J. Brickmann, in: Advances in Scientific Visualization (Eds.: F. H. Post, A. J. S. Hin), Springer Verlag, Heidelberg, 1992, pp. 58-67. - (e) J. Brickmann, T. Goetze, W. Heiden, G. Moeckel, S. Reiling, H. Vollhardt, and C.-D. Zachmann, Interactive Visualization of Molecular Scenarios with MOLCAD/SYBYL, in: Data Visualization in Molecular Science - Tools for Insight and Innovation (Ed.: J. E. Bowie), Addison-Wesley Publishing Company Inc., Reading, Mass., 1995, pp. 83-97. |
[3] |
(a) F. M. Richards, Ann. Rev. Biophys. Bioeng. 1977, 6, 151-176; Carlsberg. Res. Commun. 1979, 44, 47-63. - (b) M. L. Connolly, J. Appl. Cryst. 1983, 16, 548-558; Science 1983, 221, 709-713. (c) B. Lee and F. M. Richards, J. Mol. Biol. 1971, 55, 379-400. |
[4] |
W. Heiden, G. Moeckel, and J. Brickmann, J. Comput.-Aided Mol. Des. 1993, 7, 503-514. |
[5] |
M. Teschner, C. Henn, H. Vollhardt, S. Reiling, and J. Brickmann, J. Mol. Graphics 1994, 12, 98-105. |