The molecular orbitals (MOs) of molecules can be constructed by linear combination of atomic orbitals (LCAO).
Though the exact Schrödinger equation is unsolvable for many electron systems such as molecules,
the solution can be numerically approximated by ab initio or density functional (DFT) theory.
This page gives an overview on the molecular orbitals of various compunds calculated by DFT methods using a B3LYP/6-311++G(d,p) basis set.
Click the folders in the list below to access 3D-models of the corresponding molecular orbitals:
All MO representations are 90% isocontour probability
surfaces of the electron density (ψ2), i.e. they resemble the spatial volume around the nuclei of the molecule in which the electrons are found with the corresponding certainty.
The different colors (yellow and blue) represent regions with opposite sign of the wave function ψ;
nodal planes (not necessarily real "planar" planes) were ψ passes through zero and changes sign are indicated in orange.
a)
b)
c)
d)
3c
(T2/A1)
3b
(T2/B1)
3a
(T2/B2)
2
(A1)
-
1
(A1)
-
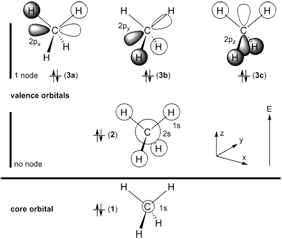
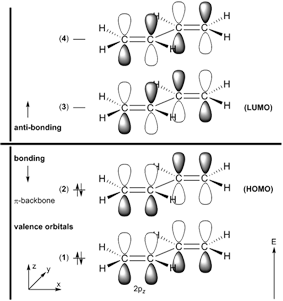
a) Orbital, only the "most interesting" valence orbitals are shown, core orbitals have been omitted;
b) MO Label (symmetry descriptor in parenthesis);
c) Nodal planes (Ψ = 0.0) and 90% probability contours of the MO electron density (Ψ2);
contours of the total electron density (sum over all MOs) are given at the 99% level by default, additional contours indicate 95, 90, 80, 70, 60, and 50% probability levels;
d) Schematic drawing of the contributions of the atomic orbitals to the MOs (the open and filled shapes of the orbitals correspond to the yellow and blue colors in the images and the 3D-models; orbital coefficients not scaled).
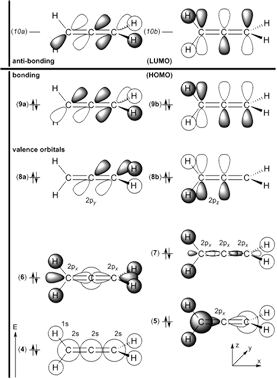
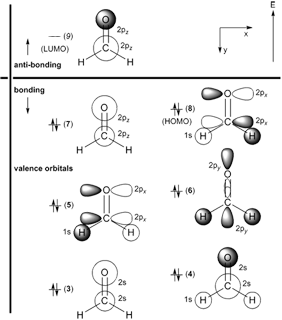
a) Orbital number, only the "most interesting" valence orbitals are shown, core orbitals have been omitted;
b) MO Label (symmetry descriptor in parenthesis);
c) Nodal planes (Ψ = 0.0) and 90% probability contours of the MO electron density (Ψ2);
contours of the total electron density (sum over all MOs) are given at the 99% level by default, additional contours indicate 95, 90, 80, 70, 60, and 50% probability levels;
d) Schematic drawing of the contributions of the atomic orbitals to the MOs (the open and filled shapes of the orbitals correspond to the yellow and blue colors in the images and the 3D-models; orbital coefficients not scaled);
e) Orbital not shown.
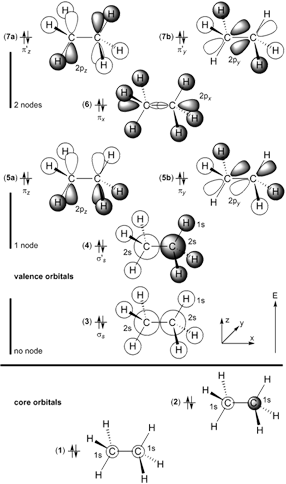
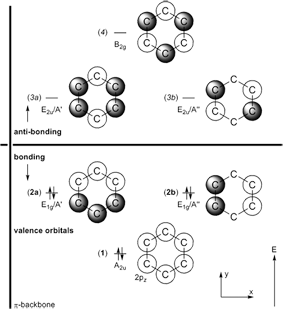
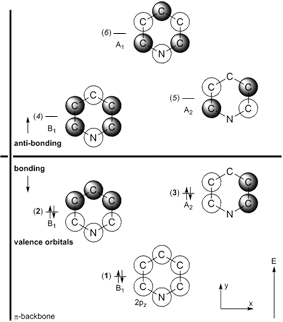
a) Orbital number (see scheme on the right, degenerate molecular orbitals (MOs) with equal energy are denoted by same numbers);
only the "most interesting" valence orbitals are shown, core orbitals have been omitted;
b) MO Label (symmetry descriptor in parenthesis);
c) Nodal planes (Ψ = 0.0) and 90% probability contours of the MO electron density (Ψ2);
contours of the total electron density (sum over all MOs) are given at the 99% level by default, additional contours indicate 95, 90, 80, 70, 60, and 50% probability levels;
d) Schematic drawing of the contributions of the atomic orbitals to the MOs (the open and filled shapes of the orbitals correspond to the yellow and blue colors in the images and the 3D-models; orbital coefficients not scaled).
a) Only the "most interesting" valence orbitals are shown, core orbitals have been omitted;
b) Arrows indicate occupancy of the orbitals, respectively;
c) Nodal planes (Ψ = 0.0) and 90% probability contours of the MO electron density (Ψ2);
contours of the total electron density (sum over all MOs) are given at the 99% level by default, additional contours indicate 95, 90, 80, 70, 60, and 50% probability levels;
d) Orbital not shown.
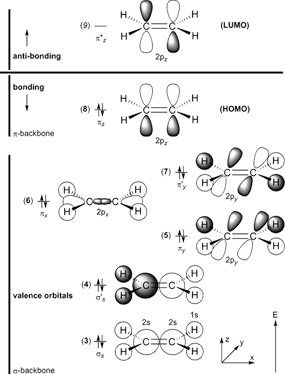
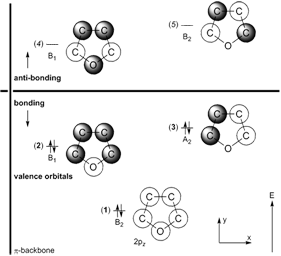
a) Orbital, only the "most interesting" valence orbitals are shown, core orbitals have been omitted;
b) MO Label (symmetry descriptor in parenthesis);
c) Nodal planes (Ψ = 0.0) and 90% probability contours of the MO electron density (Ψ2);
contours of the total electron density (sum over all MOs) are given at the 99% level by default, additional contours indicate 95, 90, 80, 70, 60, and 50% probability levels;
d) Schematic drawing of the contributions of the atomic orbitals to the MOs (the open and filled shapes of the orbitals correspond to the yellow and blue colors in the images and the 3D-models; orbital coefficients not scaled).
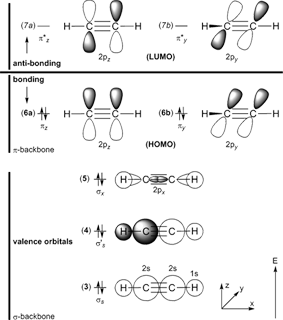
a) Orbital number, only the "most interesting" valence orbitals are shown, core orbitals have been omitted;
b) MO Label (symmetry descriptor in parenthesis);
c) Nodal planes (Ψ = 0.0) and 90% probability contours of the MO electron density (Ψ2);
contours of the total electron density (sum over all MOs) are given at the 99% level by default, additional contours indicate 95, 90, 80, 70, 60, and 50% probability levels;
d) Schematic drawing of the contributions of the atomic orbitals to the MOs (the open and filled shapes of the orbitals correspond to the yellow and blue colors in the images and the 3D-models; orbital coefficients not scaled).
a) Orbital, only the "most interesting" valence orbitals are shown, core orbitals have been omitted;
b) MO Label (symmetry descriptor in parenthesis);
c) Nodal planes (Ψ = 0.0) and 90% probability contours of the MO electron density (Ψ2);
contours of the total electron density (sum over all MOs) are given at the 99% level by default, additional contours indicate 95, 90, 80, 70, 60, and 50% probability levels;
d) Schematic drawing of the contributions of the atomic orbitals to the MOs (the open and filled shapes of the orbitals correspond to the yellow and blue colors in the images and the 3D-models; orbital coefficients not scaled).
Notes: All molecular orbitals were calculated by DFT methods using a B3LYP/6-311++G(d,p) basis set. All MO representations are 90% isocontour probability surfaces of the
electron density (Ψ2), i.e. they resemble the spatial volume around the nuclei of the molecule in which the electrons are found with a 90% certainty.
The different colors (yellow and blue) represent spatial regions with opposite sign of the wave function Ψ;
nodal planes (indicated in orange, not necessarily real "planar" planes) indicate areas were Ψ passes through zero and changes sign
(→ Ψ2 = 0.0, planes of zero electron density for a given orbital).
The total electron density contour (99% level over all MOs) renders the molecule with its characteristic shape.
3D-Models are displayed using the Jmol Applet without the need to install any other plugins with your browser.
Isocontour surfaces, nodal planes, and electron density contours may represent large files (100-1000 KBytes) which may take a moment to download.
All graphics and isocontour surfaces shown on this page were created using the MolArch+ program
in combination with the POVRAY Persistence of Vision Raytracer.
Electron densities were calculated on three dimensional grids for the corresponding molecules using the JAGUAR program.
Additional information on hydrogenic atomic orbitals and molecular can be obtained from the "Tutorials" section of this web site.